
Everything you need to know about Windows logons in one blog series continues here!
I have threatened on several occasions now to do a follow-up to my previous article on Windows logon times which incorporates the findings from my “logon times masterclass” that I have presented at a few events. The time has come for me to turn these threats into reality, so this series of articles and accompanying videos will explore every trick we know on how to improve your Windows logon times. As many of you know, I work predominantly in Remote Desktop Session Host (RDSH) environments such as Citrix Virtual Apps and Desktops, VMware Horizon, Windows Virtual Desktop, Amazon Workspaces, Parallels RAS, and the like, so a lot of the optimizations discussed here will be aligned to those sorts of end-user computing areas…but even if you are managing a purely physical Windows estate, there should be plenty of material here for you to use. The aim of this is to provide a proper statistical breakdown of what differences optimizations can make to your key performance indicators such as logon time.
This series of articles is being sponsored by uberAgent, because the most important point to make about logon times is that if you can’t measure them effectively, then you will never be able to improve them! uberAgent is my current tool of choice for measuring not just logons (which it breaks down into handy sections that we are going to use widely during this series) but every other aspect of the user’s experience. All of the measurements in this series are going to be done via uberAgent, and as it comes with free, fully-featured community and consultants’ editions, there’s absolutely no reason that you can’t download it and start using it straight away to assess your own performance metrics. I’ve written plenty about uberAgent on this blog before, and I stand by it as the best monitoring tool out there for creating customized, granular, bespoke consoles that can be used right across the business. I’ve recently deployed it into my largest current client, so you can be sure I am putting my money where my mouth is – if it didn’t do the job, I wouldn’t have used it for my customers, simple as. It now features full Citrix Cloud integration and a “user experience” score to tell you where your users are having issues, so go and try uberAgent right now – you won’t regret it!

Part #8 – startup items, optimization tools and application preloading
A treble event today, as we are getting further into the “smaller” items that we can use to optimize our logon times. Today, we are going to look at the impact of startup items on your logon times, the potential for use of application preloading, and also out of the community optimization tools, which ones make a difference to your logon KPIs?
Startup items
Firstly, let’s deal with startup items. In part #1 of this series, we talked about the difference between the actual “logon time” as defined by the system, and the “time to operational effectiveness” – the amount of time that elapses between launching a resource and the user being able to use it. Now, dependent on the way of measuring logon time that you choose, there will be less of a discrepancy between the actual “logon time” shown and the “TTOE”. uberAgent does quite a good job of measuring startup items impact onto the overall logon time – dependent on the tool you use, you may need to consider the full impact of startup times more closely.
To add some startup items in, we’ve chosen to sign the user in to OneDrive and Teams, and launch OneNote, Adobe Reader and the Citrix Workspace App, as well as additionally installing Google Chrome. Each of these has an associated startup item that will now run every time the user logs in. OneDrive, Teams and the Citrix Workspace App will auto-start and sign the user in, OneNote will launch the “QuickNote” item, Adobe Reader will run the Adobe ARM Helper, and Chrome will launch a Scheduled Task to check for updates.
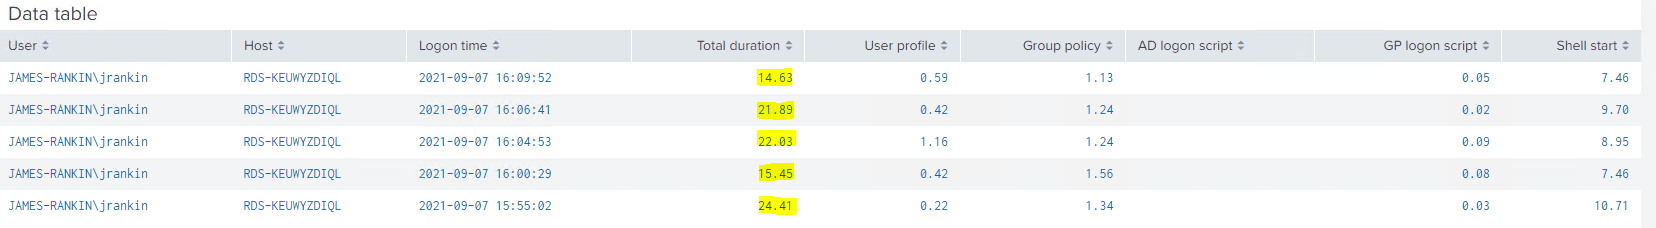
Now let’s log a user in five times via Citrix using both Windows 10 and Server 2019, and see what statistics we have.
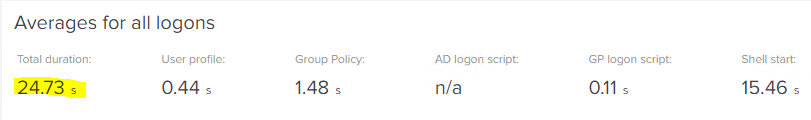
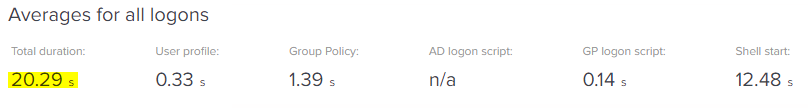
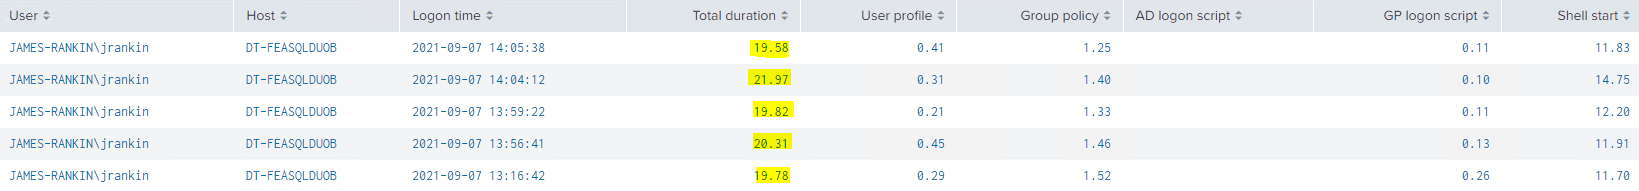
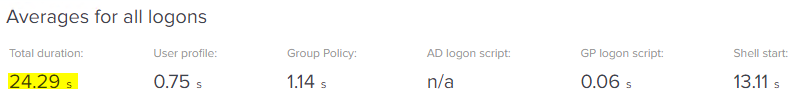
Windows 10 with startup items

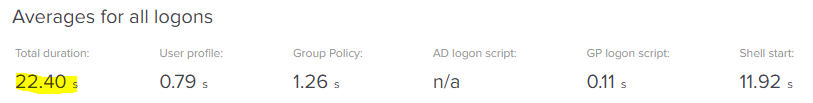
Windows Server 2019 with startup items
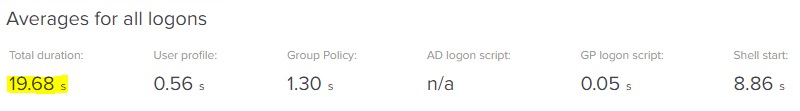
So, we’ve got an initial average of 24 seconds for Windows 10 21H1, and an initial average of 19 seconds for Windows Server 2019. These are pretty good logon times, and they seem to match pretty closely with a hand-timed TTOE measurement, so uberAgent is clearly making a good fist of measuring the impact of the auto-launched applications. But let’s see what happens when we strim them out.
There are many ways to remove startup items and I doubt very much you need me to tell you how to do any of them! For purposes of this test, we can remove most of them by using Task Manager and going into the Startup tab, so they are disabled within the user’s profile.
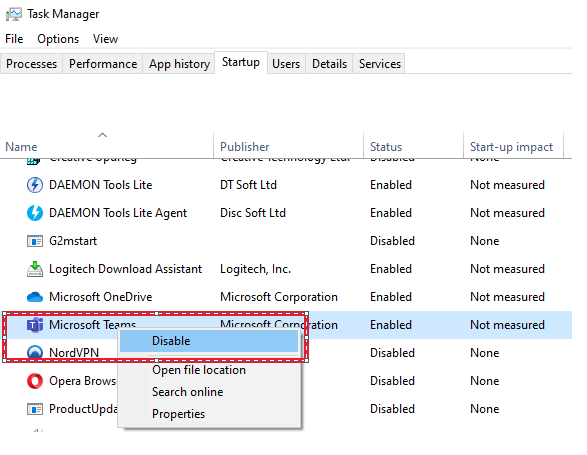
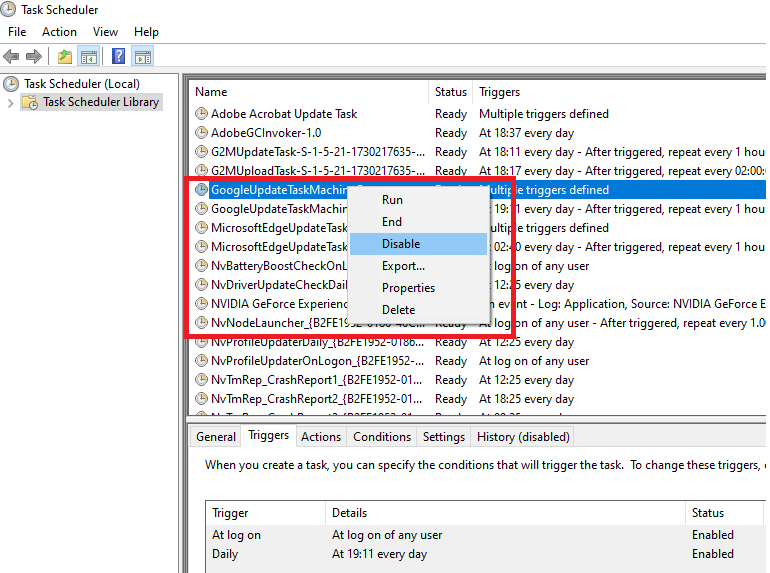
For the Chrome Scheduled Task that runs at logon, you can remove this from Task Scheduler or even using a tool like AutoRuns from SysInternals. Again, this will disable it within the user context.
Now, let’s repeat the tests without the Startup Items.
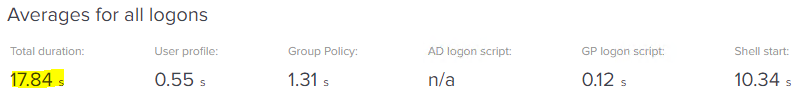
Windows 10 with startup items removed
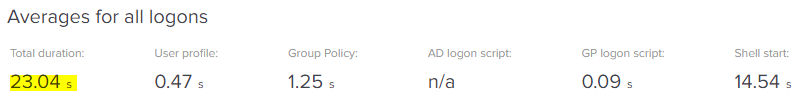
Windows Server 2019 with startup items removed
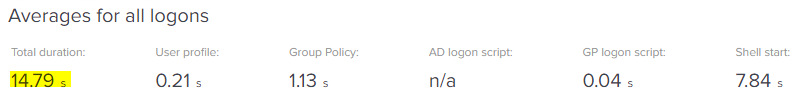
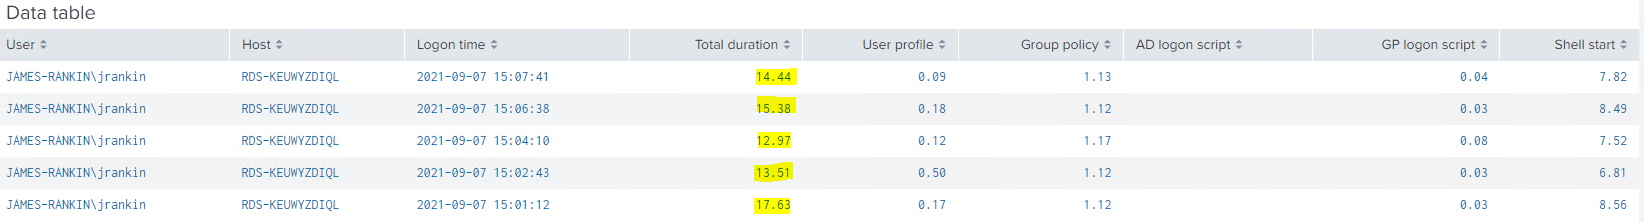
So we can see a marked difference, which obviously you’d expect. We’ve removed 4-5 seconds of logon time in each instance, which is a sizeable percentage given the good logon times we had already. The important point to make is that you should validate that the monitoring tool you choose can identify the impact of these startup items correctly, as some will report the logon as complete while startup items are still processing. We can see from these figures that uberAgent is reporting it correctly, and our hand timings back this up.
Obviously – users do find auto-starting programs handy in many cases. Signing them into OneDrive and Teams is quite normal so I wouldn’t recommend removing this if the user expects it. Stuff like OneNote QuickNotes, Adobe Reader and Google Chrome update tasks, though, can definitely be removed. Judge each startup item against the needs and expectations of the user base before removing. As I pointed out in part #1 of this article, there are certain verticals where every second counts, and some where user experience and convenience is also important. Remove startup items as appropriate for your requirements.
Optimization tools
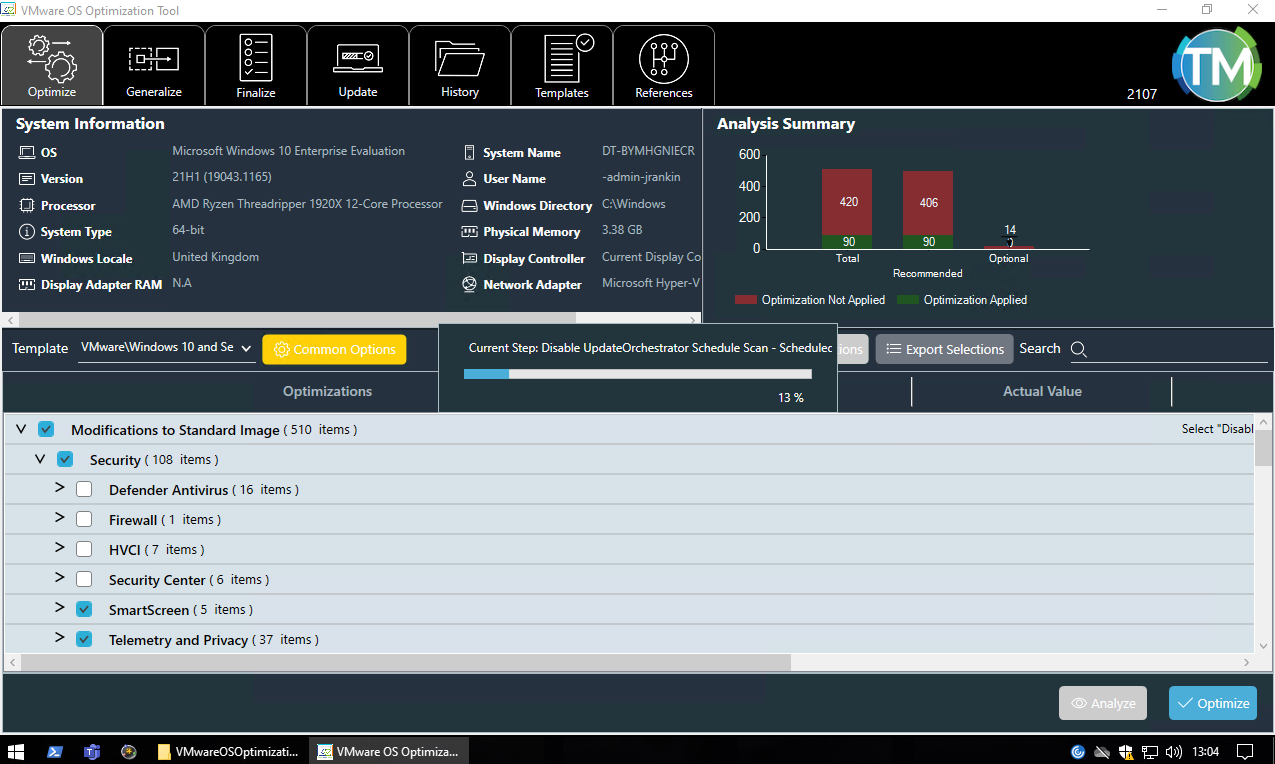
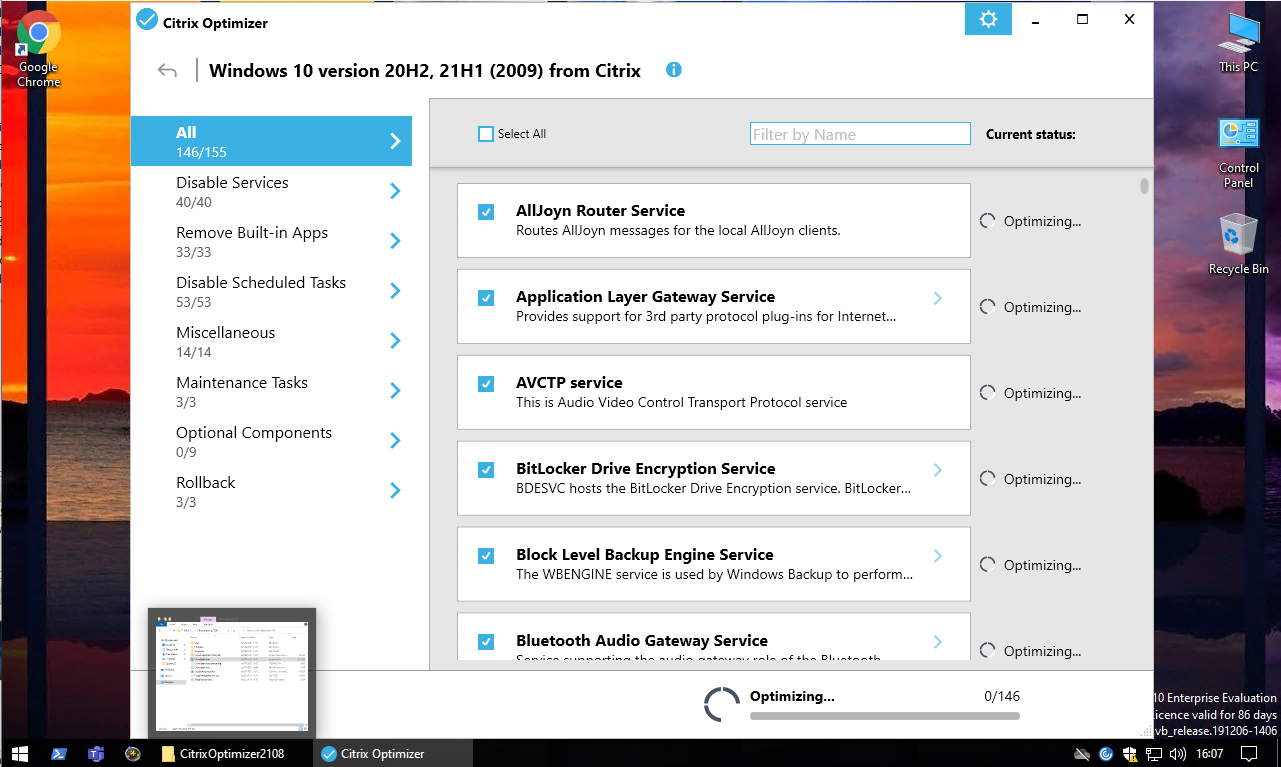
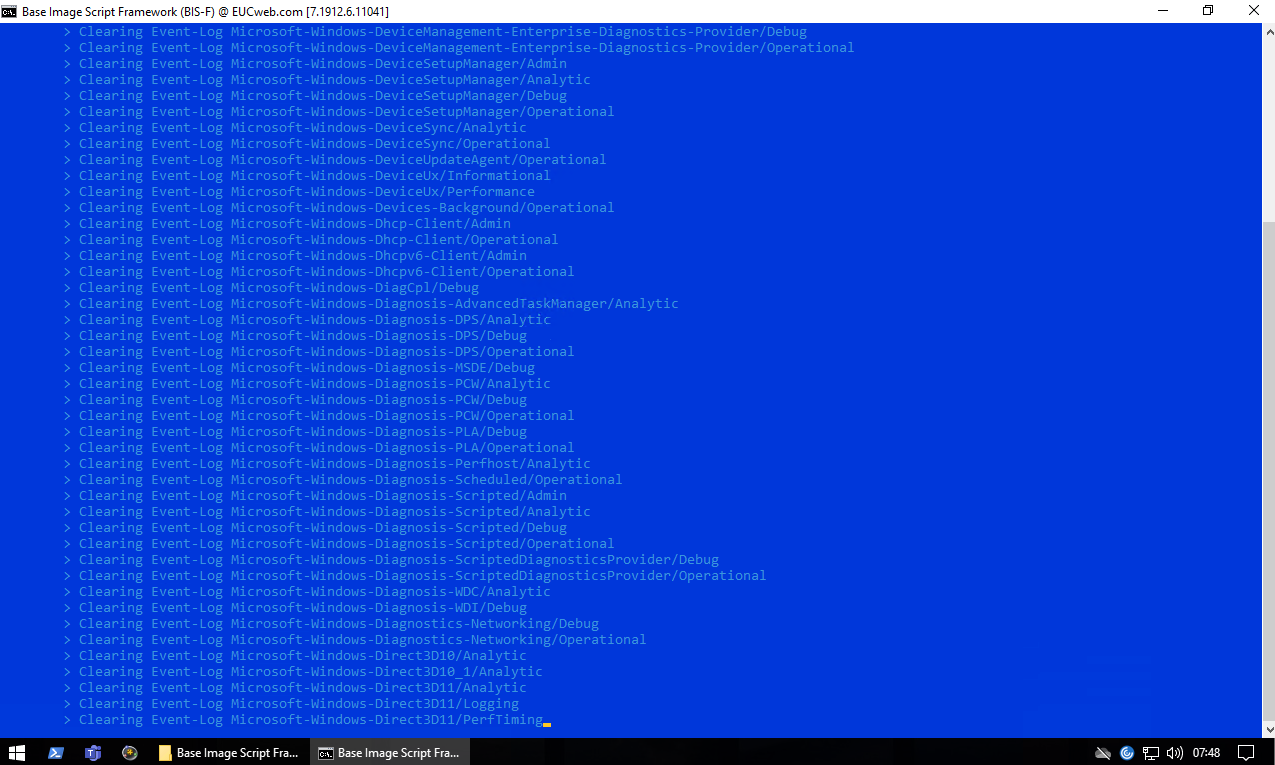
There are a number of popular optimization tools out there for virtual environments. The Citrix Optimizer, VMware OSOT, Base Image Script Framework (BIS-F) and WVD Optimizer are probably the most common ones in use. These tools all do a great job of streamlining and normalizing your base image, saving you a lot of work and keeping your images lean and clean. But do they help when it comes to logon times? We’re going to find out.
It’s worth bearing in mind that these optimization tools have a lot of options and some of them you may have already applied. For instance, they all remove unneeded Windows 10 UWP apps but I have already done this as part of my automated build. So obviously, your results will vary dependent on how much optimization you have “baked in”. There are vast numbers of settings and templates you can configure within each of these tools and it pays to take the time to tune them for your own environments. For purposes of this testing, I have run the tools with their default settings for each operating system against my own builds which are already slightly optimized.
Also, it is very important to understand what you’re trying to achieve. A lot of the templates you can use here (especially the more aggressive ones) can possibly have knock-on effects, so understanding the “impact versus reward” is very important. Testing, baselining, monitoring and snapshotting is something you should get familiar with in this instance!
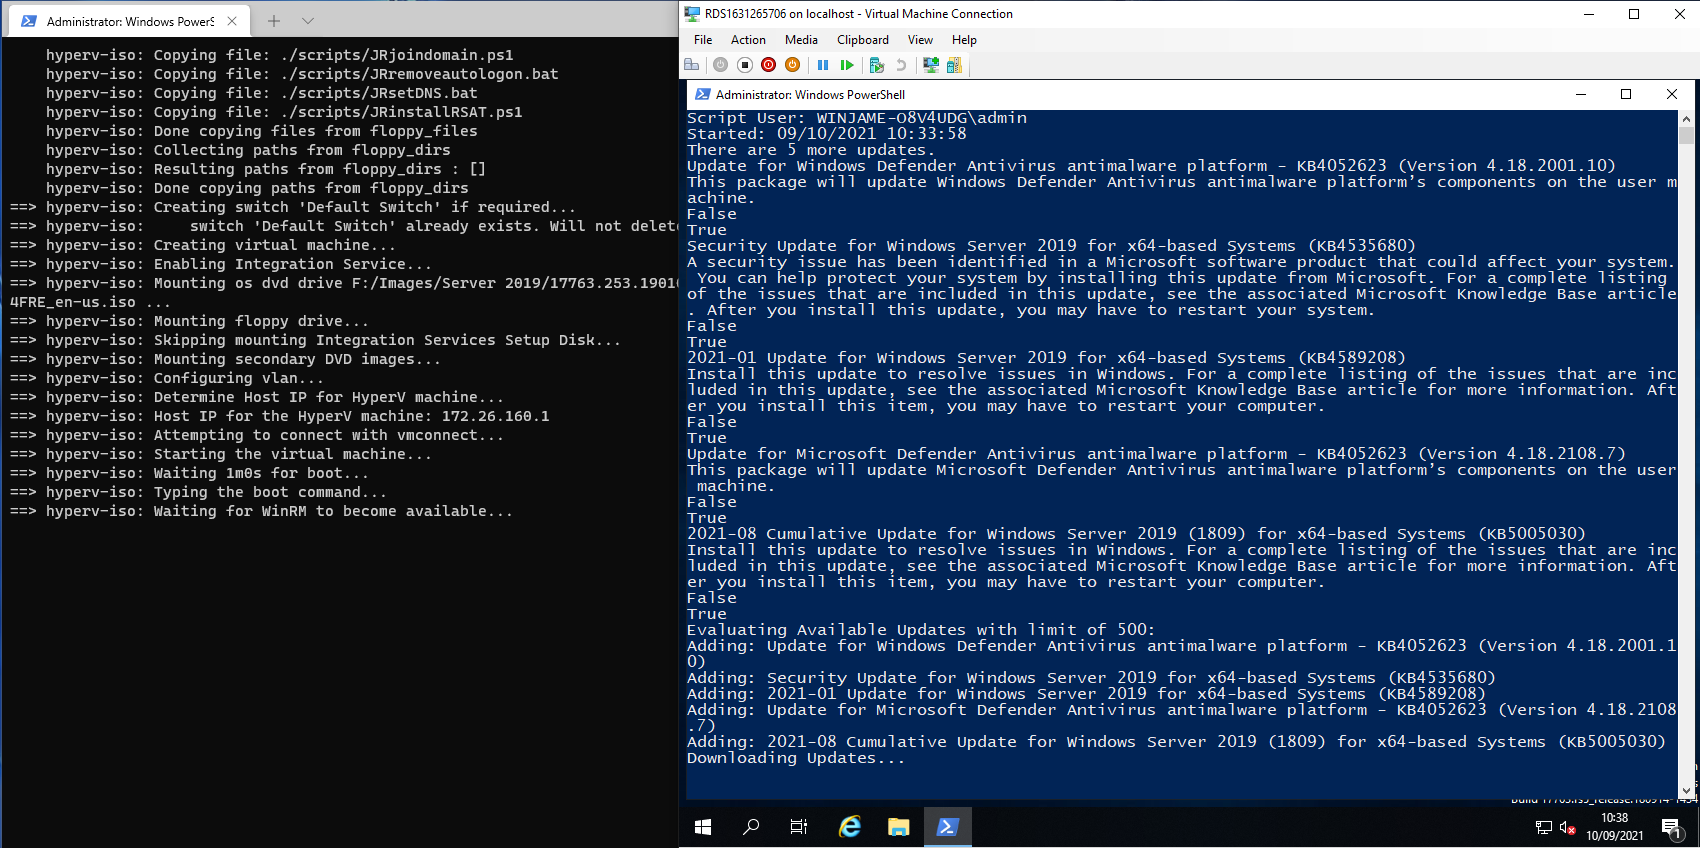
Again, let’s start by building a fresh new pair of systems for testing. I’m currently using Packer to spit out automated builds, which is great when it comes to setting up a new “clean slate” for every pass.
Once we’ve done this, let’s take a baseline of the logon times again. Here are the figures:-
Windows 10 without optimization
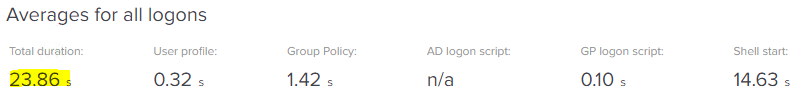
Windows Server 2019 without optimization
The results are slightly anomalous, in that I normally see Server 2019 quicker than Windows 10 (although this Windows 10 instance already has the UWP apps removed, so that maybe accounts for them being so close together in terms of timing). Anyway, we’ve established the baselines, so let’s crack on.
Let’s start with Windows Server 2019.
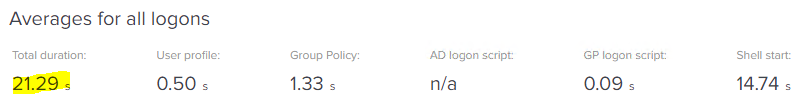
Windows Server 2019 with Citrix Optimizer
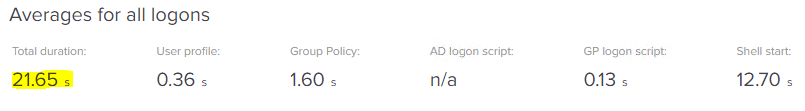
Windows Server 2019 with VMware OSOT
Windows Server 2019 with BIS-F
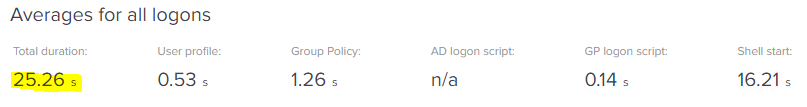
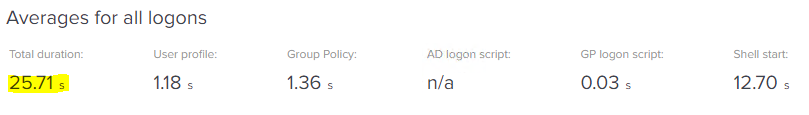
The results show that for Server 2019, optimizing with the Citrix Optimizer makes a very small difference of 25 to 24 seconds. The VMware OSOT does slightly better, taking it down to 22 seconds, but BIS-F is by far the most effective, shaving nearly 8 seconds from the logon time, down to 17 seconds overall.
And now let’s do Windows 10
Windows 10 with Citrix Optimizer
Windows 10 with VMware OSOT
Windows 10 with BIS-F
Windows 10 with WVD Optimizer scripts
The results are slightly different for Windows 10. The Citrix Optimizer does a slightly better job than on Server 2019, reducing the KPI from 25 to 23 seconds. BIS-F and the VMware OSOT are pretty close together, reducing the overall time down to 21 seconds (VMware OSOT is very slightly better). The WVD Optimization scripts also take the logon to 23 seconds, although it isn’t as good as the Citrix Optimizer’s results – 0.86 seconds slower after optimization. BIS-F doesn’t have as marked an effect in our testing on Windows 10 as it did in Server 2019.
Of course, you are maybe well aware that you can run these optimization tools together, instead of singly. What would happen if we ran all available optimization scripts? So for Windows Server 2019, we will run the Citrix, VMware and BIS-F tools – on Windows 10, we can go one better and add the WVD Optimizer scripts in there too.
Here are the results:-
Windows Server 2019, triple-optimized

Windows 10, quadruple-optimized

Here’s a graph summary of all the optimization tool testing
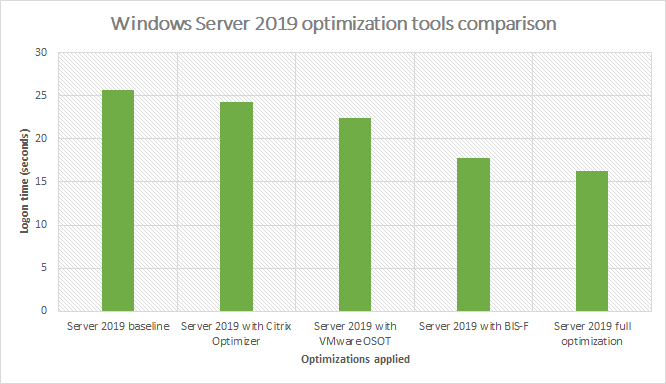
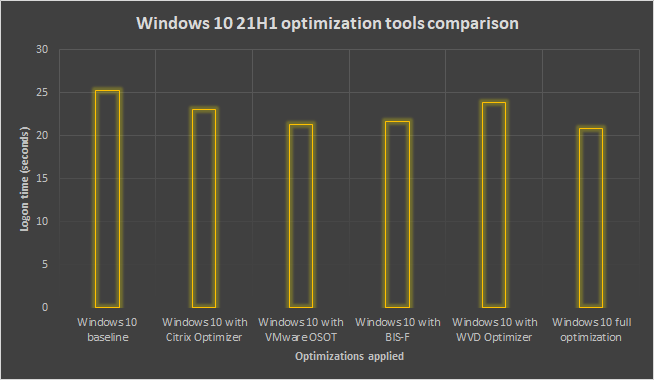
So from an optimization tools perspective, applying all of the available tools is the best approach, carving around 20% from a Windows 10 logon, and a whacking great 36% from a Server 2019 logon. Having said that, it would be very sensible to study precisely what each tool is doing before applying them, and to also consider that on Windows 10, the time saved by applying all of the tools rather than just a particular one isn’t very big (around 1-2 seconds overall).
Application preloading
Now, for pure published applications environments, you will find it out there on the internet that preloading applications at system boot can make a difference to logon time (which in published application environments is obviously application launch time). I’ve used this a few times myself, but let’s put it into a proper test to see exactly what we are gaining, if anything.
The commonest way to do this is simply to create a GPO Startup Script that launches a number (or all, if you prefer) of the applications on your VDAs at boot time. The idea is that the binaries are then preloaded by Application Prefetching, and there is then a subsequent uptick in your logon time KPI.
Obviously, this technique is only good for the first launch of the application on every VDA that you have, because once a user runs it once then it is loaded anyway. So for this testing I made sure my test user would hit a “new” server every time, to get a proper feel for the potential benefits.
An example of a Startup Script to use is given below (I’m using Notepad++ for my testing). It simply launches the app, waits a second, then launches the next one, before repeating the process as it kills off the running instances. I’m sure I read about this in a comments section a few years ago and if my memory serves me right it was Jeremy Saunders who put it out there, so kudos to him.
start notepad++.exe
timeout /t 1
start iexplore.exe
timeout /t 1
start C:\Program Files (x86)\Microsoft Office\Office16\WINWORD.exe
timeout /t 1
start C:\Program Files (x86)\Microsoft Office\Office16\EXCEL.exe
timeout /t 1
start C:\Program Files (x86)\Microsoft Office\Office16\POWERPNT.exe
timeout /t 1
start C:\Program Files (x86)\Adobe\Acrobat Reader DC\Reader\AcroRd32.exe
timeout /t 3
taskkill /IM notepad++.exe
timeout /t 1
taskkill /IM iexplore.exe
timeout /t 1
taskkill /IM WINWORD.exe
timeout /t 1
taskkill /IM EXCEL.exe
timeout /t 1
taskkill /IM POWERPNT.exe
timeout /t 1
taskkill /IM AcroRd32.exe
Now, before we link the GPO we have created, let’s take a baseline of our Notepad++ published application launching. After each launch, we will put the VDA we hit into maintenance mode so we’re not hitting a server that we’ve previously launched the app on.
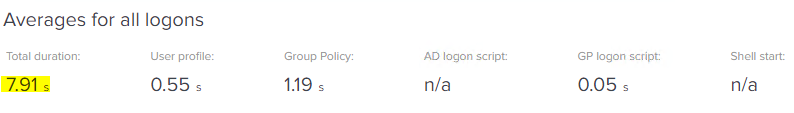
7.91 seconds – pretty good for a published application, although it’s obviously quite a simple one.
Now let’s link the GPO with the Startup Script, and reboot all of our VDAs so they do the preloading. We are then repeating the test. This time it doesn’t matter about hitting different servers each time, but just for posterity, we did the same as in the baseline testing.
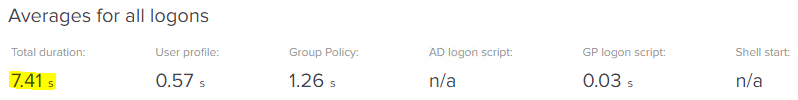
That’s a clear 0.5 second improvement, and better than I’d expected. So it just goes to show (even though technically, this improvement might not apply to all sessions) that there is a net benefit to be gained.
Summary
So, what can we summarize from this exploration of some of the more “fringe” options for logon time optimization?
Firstly, startup apps can have a big impact. I guess we all already knew this, but it’s worth looking at how many you have. Obviously a lot of users expect certain things to launch automatically, but there may well be many out there you weren’t aware of and can get rid of.
Secondly, optimization tools can cut down on a lot of the improvement effort required when it comes to cutting logon times. However, it is important to understand the mechanics of what each tool is doing to ensure that user experience or solution performance isn’t compromised.
Finally, application preloading is a viable improvement vector for published application environments, albeit in a slightly limited way. This is probably one of those “niche” optimizations for specific verticals.
We are closing in on the last few instalments of this series now, but stay tuned for some more articles and videos on an array of subjects in the coming weeks.
![]()
Hi, few years im using the VMware OSOT, but i have problem with slow task bar loading (delayed) do you have experience to ? The slow loading is only, when i deploy image in horizon deskop pool and i login in. When i login locally after OSOT is loading OK. Any advice ?
Tomas
Sorry, I’ve pretty much stuck to the Citrix Optimizer and/or BIS-F recently, so haven’t seen this issue.