
The first part of an in-depth exploration of uberAgent – getting it up and running
If you’ve ever seen any of my presentations, I constantly go on about the importance of monitoring. I take every possible opportunity to stress this – the user experience you can deliver is only as good as your understanding of your environment, your applications and your users’ behaviour. But still – even after all of this time – I STILL see projects going ahead where monitoring isn’t part of the scope. It’s addressed afterwards – or, in some cases, not at all.
Good monitoring is not a project component. It should be embraced and encompassed by the whole business. However, sometimes it is difficult to build a business case for adopting monitoring so broadly, so an upgrade, migration or improvement project can be the ideal place for it to start. Any project that provides a service to the user base SHOULD ABSOLUTELY HAVE A MONITORING COMPONENT as a part of it, and ideally, one that can then be extended into the rest of the infrastructure.
But this doesn’t mean you need to have one monitoring solution to fit every part of your estate. Some solutions concentrate specifically on particular areas and excel within those. There is a good chance you may need to aggregate multiple monitoring solutions together and present the information differently for different administrators.
Whatever you are monitoring, you need to tick several boxes. Good monitoring needs to:-
- Build a picture of your environment, your applications, and how your users behave
- Deliver real-time actionable data tailored to administrators
- Maintain historical data for trending and analysis
- Provide informative dashboards for both executive and administrative overview
However, it is often difficult for busy systems admins to have the time to understand how well a monitoring product can fulfil these requirements. Let’s introduce you to “The Unknown SysAdmin”.
The Unknown SysAdmin
The Unknown SysAdmin (AdminX, as I will call them) is a bit of all of us. AdminX is generally:-
- Dedicated
- Very interested in technology and technical solutions
- Not paid enough for all of the extra hours they put in
- Very competent with some of the technologies they use every day, and reasonably proficient with all of the other technologies they use
- Engaged in firefighting for most of their typical day
- Not involved in driving the strategic direction of the IT side of the business, but feeds into it from a technical perspective
- Short of time to spend assessing new products
- Always in pursuit of training, but struggles to get it
- A bit suspicious of vendor pitches
- Someone who would like their life to be made a little bit easier
Sound familiar? I guess most of us either live, or have lived, in the shoes of AdminX. Let’s approach this exploration of the uberAgent product through the eyes of your typical overworked IT person.
Building a picture of your environment
So, your typical IT estate with some (or a lot) of exposure to SBC/RDSH/VDI technology often encompasses a lot of moving parts. They are never straightforward. As the years go by, and changes and fixes and upgrades are layered on top of the existing infrastructure, the complexity level increases. Of course we all should be documenting every single change, right? In practice – things get missed. AdminX is always busy heading towards the next problem, and even though all of us are usually diligent about keeping records, there will always be pieces that slip through.
So this is where monitoring can help out an awful lot. It can help AdminX build a true picture of how their environment looks. Now there’s a good chance that they know a lot of this – but have never truly been able to flesh it out. And what you don’t want is AdminX to leave and take all that knowledge with them. Building a good monitoring solution is an ideal time to visualize and document all the quirks of your environment – and ensure that losing a valued staff member won’t be as much of a disaster as it could be.
It’s all about the applications.
This is so true. However you skin it, all of the pieces of our IT estates converge together with one single purpose in mind – to deliver applications to the users to allow them to do their jobs and benefit the business. But in the modern world, sometimes even knowing our applications can start to slip away from us.
In an ideal world, every enterprise would know exactly what applications they have in use, how often they are used, and by whom. Unfortunately, software inventory is rarely, if ever, taken as seriously as hardware inventory—in many cases, it is not done at all. I have yet to work on a single project where the business had a complete overview of its software estate; many simply shrug their shoulders when confronted with questions around it. The problem is further exacerbated when companies are composed of disparate business units or have grown by acquisition. It gets even worse when you factor in “seasonal” applications that may only be used at specific times of year or in particular circumstances. In worst-case scenarios, you may even be dealing with applications that the IT department isn’t aware of—certain business areas may have subscribed to SaaS applications they use online, or they may have developed things themselves that have become critical to their own particular area, such as Access databases and the like. In the cloud world, Shadow IT (as it is known) can become a really serious issue.
So, when you start to look at implementing a monitoring solution, you are looking to go beyond the knowledge that exists within the IT department itself. Surveying users and taking time and resource metrics can’t be relied on to provide the information required: users often forget some of the tools they use. Automated monitoring solutions are the best action you can take – they gather as much data as they possibly can. This should then be supplemented with user and IT administration knowledge.
Each application needs to be fully understood. As I just said, monitoring tools provide some of this information (the technical parts that are often difficult to get), and this is added to the softer information that you can gain from users and administrators. Here is a diagram I often use when trying to decide what AdminX will need to understand about every application:-
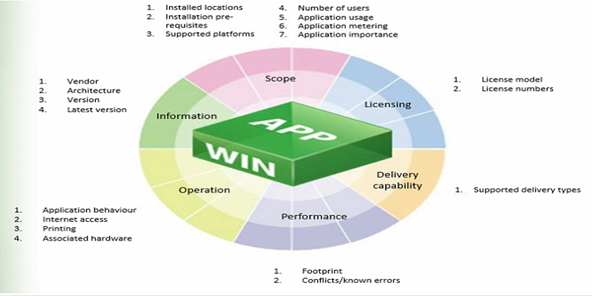
A good monitoring solution should help out with what applications are being used, where they are installed, how often they are being used, who are they being used by, where they send their traffic, what resources do they use, and what errors they are generating. You should also be able to see what cloud services or SaaS apps are being accessed. With the right breakdown of the data, your monitoring solution should help you build an important picture of your application estate and any problems within it.
Real-time and historic data
So, we know that a good monitoring solution will help AdminX start to build a comprehensive picture of their environment, but we also need to take that data and provide dashboards for real-time and historic analysis. This sort of trending capability is vital.
First of all, for any admin worth his salt, a real-time dashboard is critical. Highlighting areas of concern and degradation is key. Let’s not forget, a service often starts to slow down before it becomes unusable and the users actively start to call in about an issue. Getting the visibility of that changing status before it becomes a problem is the key to being proactive rather than reactive in your troubleshooting.
Also, if a user has a problem, how do you troubleshoot it? Do you just guess and start working through every infrastructure component from there? Whilst the skills of support staff are crucial, the point I made with AdminX is that these people are often under pressure and overworked. Anything that can narrow down the problem translates to saved time. If you could pull up a dashboard of the user’s current status, then you could easily begin to attack the issue from a position of strength.
Historical data is also very important. Change management is a key area of this. How do you know your latest GPO change won’t impact user experience? AdminX’s usual response would be “well I would test it”. But how do you know that test will cover every eventuality? How do you know what impact it could have on key user interactions with their applications? If you have monitoring in place that can provide all of the key metrics, then you can see straight away what the potential impact of your change is and take actions to mitigate before you even send it live.
There’s also the issue of perception. A user may ring up and say “my logon takes too long”. Without historical data to measure the trend against, how do you know their logon time has been any better or any worse than yesterday or the previous week? One man’s fast can be another man’s slow – and without anything to measure it against, you simply have to take the user’s word for it, potentially wasting support staff time trying to fix a problem that doesn’t exist.
You may also want to measure the quality of your services over time using historical dashboards. You can see how capacity utilization is changing, whether you need to scale up (or scale down!). Having detailed historical data in any easy-to-access visualization is a great asset to any business.
Choosing a solution
So, we’ve established that our typical admin would benefit greatly from a monitoring solution on a number of levels. But let’s not forget that this is a crowded space – vendors big and small, cloud and on-premises, are always looking to sell their wares to enterprises out there. What would the reason be for AdminX to look at uberAgent?
One first big reason why I would look at uberAgent is because it is respected in the community and I hear a lot of good feedback about it. I can’t stress this enough. The EUC community is an excellent resource to tap into – particularly if you don’t have the time (like AdminX) to do a thorough an in-depth comparison of products in the same space. When a product engages with the community, they open themselves up to a deep technical inspection by lots of experts – experts who are real-life administrators, architects and consultants who will ask the pertinent questions, concerning things that sales and marketing often don’t look into, like support, resilience, roadmap, integrations, etc. If you see products being discussed and feted by the community, there’s a good chance you may be able to make your list of possible solutions a good bit shorter.
Also, I know that the guys behind uberAgent have some damn good product pedigrees. Helge Klein is the CEO of Vast Limits GmbH and he originally created Sepago Profile Management (which now lives on as Citrix User Profile Management), and tools like delprof and SetACL that I use on a regular basis. Knowing that someone is behind this who understands people like AdminX and creates tools that help them out in their day-to-day tasks is another great reason why I would definitely be considering uberAgent as an option. Let’s not forget about all the other great technical guys at Vast Limits as well – I know several of them who are active in the community and again, if you’re willing to open up to the community, you’re always going to be seen in a better light because it is clear that you value and appreciate the feedback of others, and aren’t afraid to put your product out there to stand up to close scrutiny.
uberAgent also runs on top of Splunk, which is a well-established product used for searching, monitoring and analyzing machine-generated data. Sitting on top of such an established framework is again, in my opinion, a distinct advantage. uberAgent is simply a Splunk agent that doesn’t just collect counters from the operating system – it gathers the data that matters to you and uses its own metrics. Again, having a team behind it that are steeped in EUC history means that I’d trust them to gather the data that is really valuable to your average AdminX person. If you were an existing Splunk customer, then adding uberAgent to the mix would be an absolute no-brainer, but even if you’re not, having a product that sits on top of an industry-standard framework gives a certain level of confidence in the architecture that you’re adopting.
Yet another good reason for looking at uberAgent is the fact that they won’t cut you off at the end of a trial. I’ve had run-ins with several software companies who, after a trial license expired, essentially held all of the customer data hostage until a commercial agreement was reached. This is very frustrating and does not breed confidence in the company you are potentially entering into a relationship with. uberAgent doesn’t stop working or gathering data or even block you from accessing it – it simply nags the users instead with a popup reminding them that the software is in evaluation mode. This is a great thought for people out there like our AdminX, because if there are hold-ups in procurement or any other issues, they don’t suffer any losses because of it. Add to this the fact that there is a fully featured community version for up to 100 users (ideal for POCs or development environments) and again, this feels like a tool written with the administrator at heart.
Getting started with uberAgent
So AdminX knows what they need, and they also know that uberAgent is one of the options they should be looking at. The next step, naturally, is to put uberAgent in place and get it up and running. Let’s do that!
The first thing to do is to download the uberAgent software and also the Splunk Enterprise framework. Splunk Enterprise and Splunk Cloud both have trial versions available – Splunk will run in Enterprise mode for 60 days (with a limit of 500MB data upload per day) before it switches to the Free version. If you wish to use uberAgent with Splunk Cloud, you need to also configure the HTTP Event Collector, the configuration of which is documented here.
You can configure uberAgent in standalone mode (which has the smallest footprint) or configure it with Splunk’s Universal Forwarder. Using the Universal Forwarder has a larger footprint but also allows additional data to be collected and can cache the gathered data locally on disk before forwarding it on. For purposes of this article, we are going to use the first option.
Splunk installation
Installing Splunk is pretty straightforward
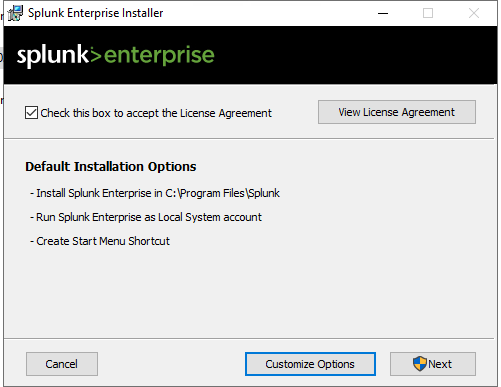

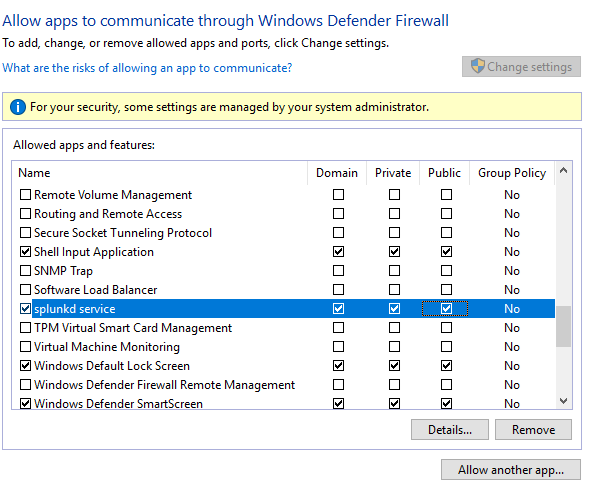
This is good news for people like AdminX – they like a simple, straightforward install. Make sure that the Windows firewall is configured to allow traffic from splunkd.exe and splunkweb.exe as below. Interestingly, on my Splunk installation I could only find splunkd.exe in the c:\Program Files\Splunk\bin folder, there was no splunkweb.exe present. However allowing the splunkd service to communicate seems to be working fine for me – it is possible that this may just be an anomalous difference between Splunk versions.
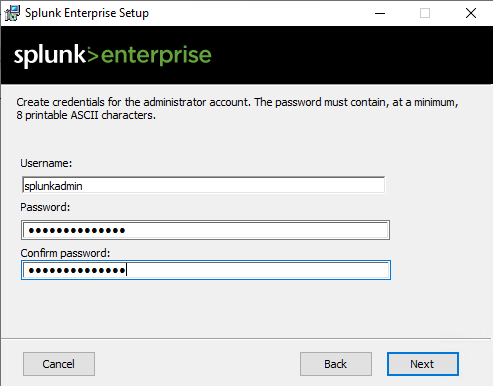
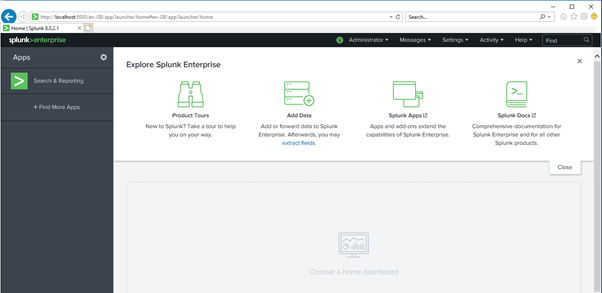
Once you are done installing Splunk, you can then log in to the Splunk console site through your browser using the username and password specified earlier.
Installing the uberAgent apps for Splunk
Next step for AdminX is to actually install uberAgent itself. Admittedly, this is a point where AdminX might go “ooh, this looks a bit complicated”. The lack of an MSI installer in the download and a couple of packed .tgz files (which to some of us look a bit Linux-y!) often have this effect. However, it is important to remember that we are not doing a typical Windows install at this stage, we are adding the apps into our Splunk installation. Once we get down to doing the install of uberAgent onto the endpoints, we will be back to standard Windows installs, so don’t start panicking!
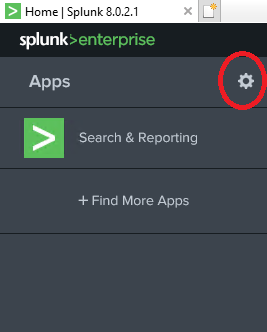
You need to log into the Splunk console and click on the “gear” icon
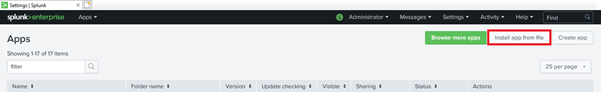
And then click on “Install app from file”
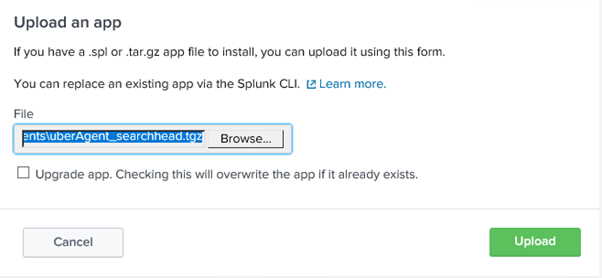
Upload uberAgent_indexer.tgz first

Followed by uberAgent_searchhead.tgz
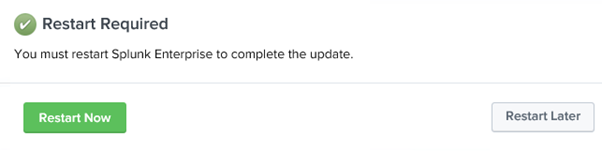
After you have done this, restart Splunk when prompted.
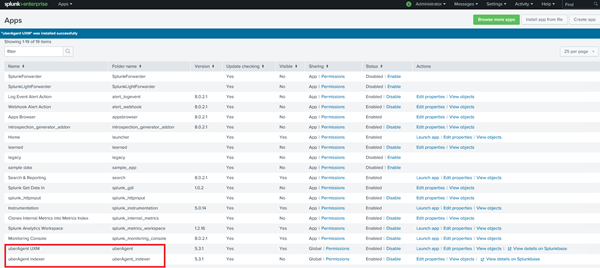
Once the restart completes and you log back in to the Splunk console, you should now see uberAgent references in the list of installed apps as below. Pretty simple and not too Linux-y at all!
Installing uberAgent on your endpoints
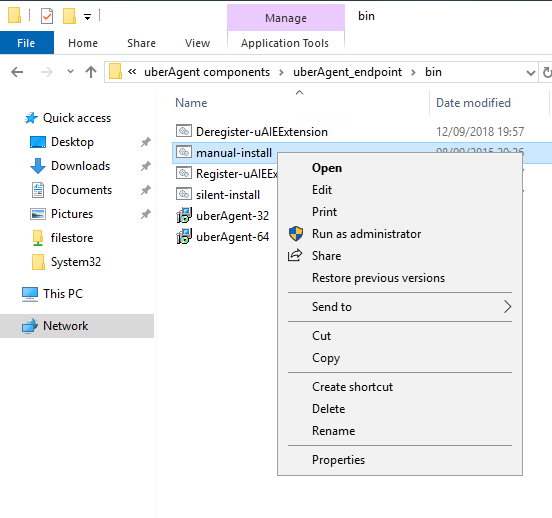
Now obviously the next step is to get uberAgent onto the endpoints and other systems you wish to monitor. As the installer is a standard MSI then you can use any number of standard software deployment methods or you can install it manually. As we are doing a small deployment in this case, we will use the manual install method. There is plenty of documentation on using other methods available.
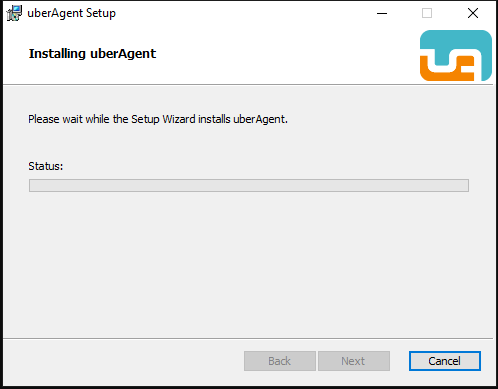
Within the uberAgent_endpoint folder in the source files is a command script called manual-install. Run this to initiate a manual install.
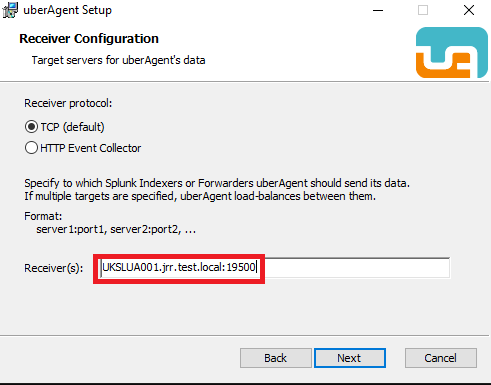
At the Receiver Configuration screen, you need to specify TCP (unless you are using the HTTP Event Collector) and the name of your server and the port. This screen can be a little bit confusing as it does not mention the default port (which is 19500).
Once this detail is provided the installation will commence on the target
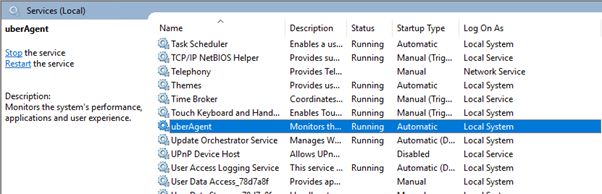
You can easily tell if the installation was successful by verifying that the uberAgent service is running successfully on the endpoint.
License
Now, if you have a license file, simply make sure you place it at C:\Program Files\vast limits\uberAgent on your endpoint machines. But as I said previously, even if you are simply using the trial, you will be presented with a nag screen, rather than actually being restricted.
PVS considerations
Those of you in Citrix Provisioning Services environments (or other “read-only” imaging methods) will naturally want to make sure that the uberAgent installation is “normalized” before deploying multiple servers from the image with the agent installed.
You can simply achieve this by using the following two commands in an image sealing script or process (bearing in mind they require running as admin)
net stop uberAgent
reg delete "HKLM\SOFTWARE\vast limits\uberAgent" /f /reg:64
Citrix DDC considerations
If you are in a Citrix environment (as I am!) then there are also some additional steps to consider when installing the uberAgent software onto your Desktop Delivery Controllers (DDCs). uberAgent automatically activates additional site-specific metrics when it is installed onto a Citrix DDC. What it requires is permissions in order to be able to read the Citrix site.
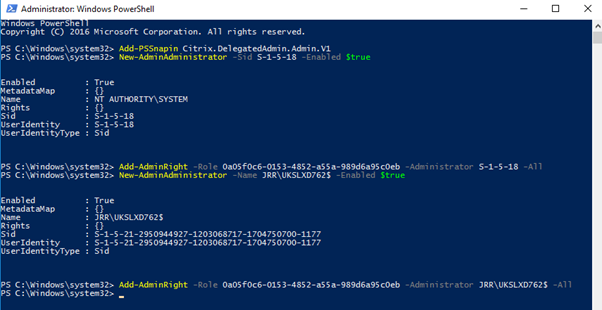
There is a template script available (reproduced below) that can be run to allow the permissions to be set as required.
Add-PSSnapin Citrix.DelegatedAdmin.Admin.V1

New-AdminAdministrator -Sid S-1-5-18 -Enabled $true

Add-AdminRight -Role 0a05f0c6-0153-4852-a55a-989d6a95c0eb -Administrator S-1-5-18 -All

New-AdminAdministrator -Name JRR\UKSLXD762$ -Enabled $true

Add-AdminRight -Role 0a05f0c6-0153-4852-a55a-989d6a95c0eb -Administrator JRR\UKSLXD762$ -All
This example shows the name of my domain and the DDC’s computer account (the DDC name with a $ on the end) in the fourth line, so these should be replaced with your own. This should be run from an administrative PowerShell session as below. If you have multiple DDCs, simply repeat the last two lines of the script with the DDC names added.
Once this is done, perform the uberAgent install as required.
ADC (NetScaler) considerations
You can also configure uberAgent to monitor your ADCs (the product formerly known as NetScaler). The configuration is covered in this document. We have skipped over it here as we do not have an ADC in play in this implementation.
Browser considerations
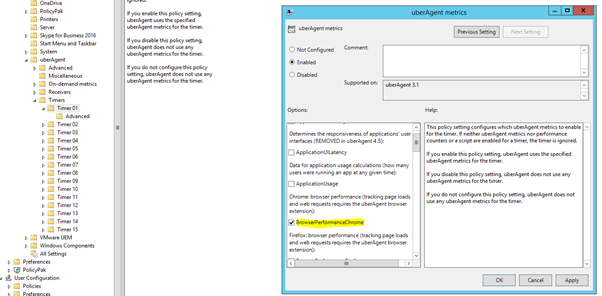
If you wish to perform deep monitoring of browser performance, there are uberAgent extensions available for Internet Explorer, Google Chrome and Firefox. You must enable these within your image in order to allow uberAgent to gather the data. In my environment, I primarily use Google Chrome, so I need to enable the extension for Chrome within the image that is used to deploy my worker servers.
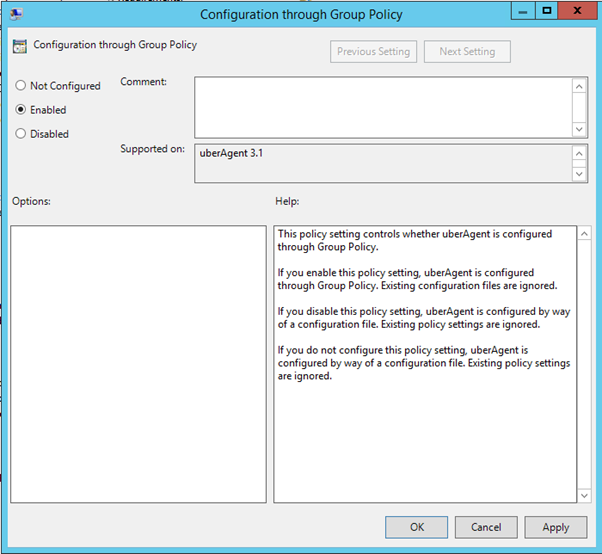
Firstly you need to enable the metric for BrowserPerformanceChrome. It should, however, be enabled by default. You can manage the uberAgent configuration either through Group Policy or an uberAgent.conf configuration file. I would recommend using Group Policy for this to integrate with your existing management infrastructure. There are ADMX files available from the download package. Once you load these files into your local or central store, you should have the GPO configuration settings available for use in Admin Templates | uberAgent.
Make sure that you configure the setting so that uberAgent uses Group Policy rather than the configuration file, just to make sure there is no conflict between the two.
Enabling browser performance metric through GPO is done by using the setting from uberAgent | Timers | TimerXX | uberAgent Metrics | BrowserPerformanceChrome. As said previously, though, this should be enabled by default.
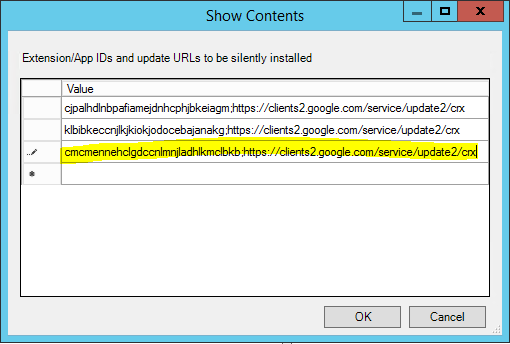
You can easily use GPO to also force-install the uberAgent extension by using Admin Templates | Google | Google Chrome | Extensions | Configure the list of force-installed apps and extensions. Simply add the following line to this GPO setting
cmcmennehclgdccnlmnjladhlkmclbkb;https://clients2.google.com/service/update2/crxNOTE – this is for the “release” channel of the extension, if you wish to use the beta version, there is a different extension ID. It is fully documented here should you wish to use it.
Once this is done within your golden image or deployed to the workers, you should now always be collecting Chrome data from your user sessions.
Verifying your install
So the next question on AdminX’s mind will naturally be – how do I know my endpoints are now successfully communicating with the Splunk server?
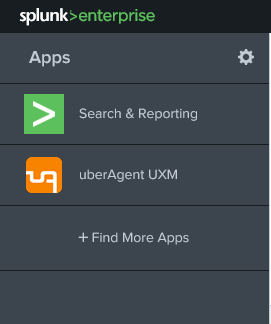
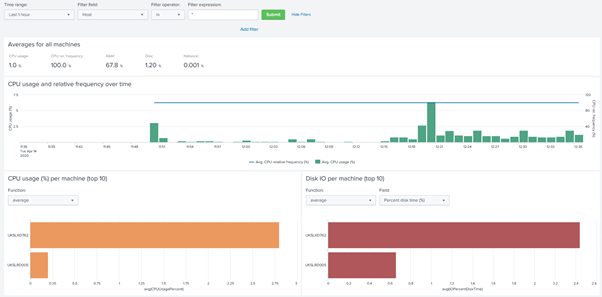
Well this is another part that I found refreshingly simple…go to the Splunk dashboard and click on uberAgent UXM on the left…
Click on Machines and then one of the options (like Machine Performance) …
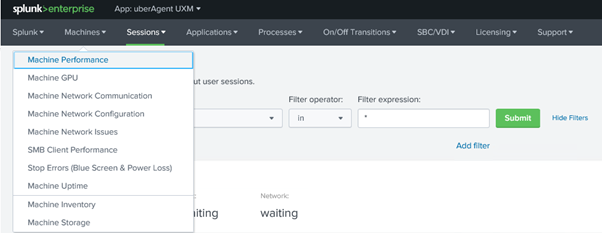
…and hey presto…we can see DATA! The data we see has the names of the servers we have added, so we know it’s definitely ours 🙂
That was pretty straightforward, so now AdminX is sitting feeling pretty satisfied with him or herself, and we can move onto the next part – getting this data presented in a way that gives our admin the visibility that they need. We will pick this up in part #2 of this series, which should be along pretty soon.
This is a series of featured articles sponsored by uberAgent. If you can’t wait for the next instalment, feel free to go and visit them at https://uberagent.com/
![]()