
Everything you need to know about Windows logons in one blog series continues here!
I have threatened on several occasions now to do a follow-up to my previous article on Windows logon times which incorporates the findings from my “logon times masterclass” that I have presented at a few events. The time has come for me to turn these threats into reality, so this series of articles and accompanying videos will explore every trick we know on how to improve your Windows logon times. As many of you know, I work predominantly in Remote Desktop Session Host (RDSH) environments such as Citrix Virtual Apps and Desktops, VMware Horizon, Windows Virtual Desktop, Amazon Workspaces, Parallels RAS, and the like, so a lot of the optimizations discussed here will be aligned to those sorts of end-user computing areas…but even if you are managing a purely physical Windows estate, there should be plenty of material here for you to use. The aim of this is to provide a proper statistical breakdown of what differences optimizations can make to your key performance indicators such as logon time.
This series of articles is being sponsored by uberAgent, because the most important point to make about logon times is that if you can’t measure them effectively, then you will never be able to improve them! uberAgent is my current tool of choice for measuring not just logons (which it breaks down into handy sections that we are going to use widely during this series) but every other aspect of the user’s experience. All of the measurements in this series are going to be done via uberAgent, and as it comes with free, fully-featured community and consultants’ editions, there’s absolutely no reason that you can’t download it and start using it straight away to assess your own performance metrics. I’ve written plenty about uberAgent on this blog before, and I stand by it as the best monitoring tool out there for creating customized, granular, bespoke consoles that can be used right across the business. I’ve recently deployed it into my largest current client, so you can be sure I am putting my money where my mouth is – if it didn’t do the job, I wouldn’t have used it for my customers, simple as. Go and try uberAgent right now – you won’t regret it!
Part 4 – user Group Policy processing
Introduction
Group Policy Objects should be very familiar to everyone in enterprise IT. They’ve been around since Windows 2000, and have developed quite strongly over the years. GPOs can be applied at domain, site, OU or device level and can apply computer or user configuration items to the user and computer objects in AD. They’re found in almost every Active Directory environment in the world, so they’re a vital consideration when it comes to talking about logon times. In fact. I’d go so far to say that they’re one of the most common bottlenecks I see at customers when dealing with logon times, because user Group Policy must generally be processed and completed before the logon can be finished (there are ways of offsetting it, which we will discuss later). In my experience, user GPO processing will always add to the logon time – anywhere from ten seconds up to multiple minutes is what I seem to expect and to observe.
Is Group Policy still relevant? It certainly hasn’t had an engine update for a long time (2007 was the last, if I recall correctly), and a lot of people seem to think that technology like PowerShell Desired State Configuration and/or InTune ADMX will eventually replace it. I’m not so sure – as of today, Microsoft still recommend using GPOs as the way to configure “domain-joined devices in a granular fashion”. I think that’s the key element – granularity. The likes of InTune are very much more of a lighter brush to paint devices with at the moment – very much unlike the obscenely granular control you can get with Group Policy – and GPOs are so deeply embedded into enterprises it will be quite a number of years before I could ever see them disappearing entirely. Which is not to say it won’t – the likes of InTune and DSC and other “modern management” tools are on the rise, and eventually GPOs may be superseded as a “domain” becomes less a ring-fenced enterprise perimeter and more of a federated access subscription model. But for now, and certainly for anyone who isn’t a completely greenfield site, Group Policy is something that you’re going to have to deal with for at least the next few years.
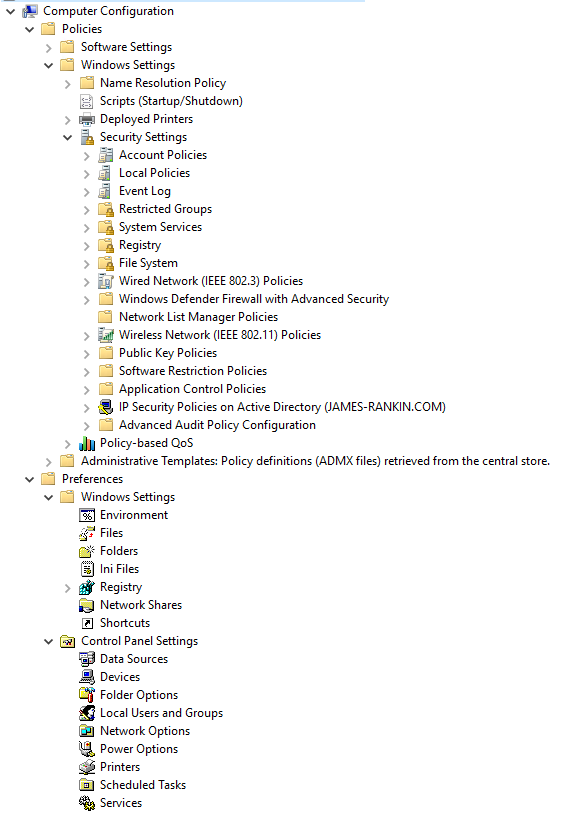
Group Policy might seem like a monolithic construct, but it isn’t, really. It’s a framework that can be extended quite easily. Microsoft provides the engine and a significant set of modules to get you started – vendors (such as Citrix) can add their own. These modules are called client-side extensions (CSEs). All of the nodes that you see in Group Policy Management are individual CSEs. They live in DLLs that are registered in the Registry key HKLM\SOFTWARE\Microsoft\Windows NT\CurrentVersion\Winlogon\GPExtensions
When a user logs on and their user Group Policies are processed, the underlying DLL has to be located, initialized, and then processed. Each one of these CSE files takes a particular time to load, so it may be of benefit to try and avoid those that take longest to load (we will talk more about this later).
You may be wondering what order the CSEs execute in. They are processed in the order shown below, which is basically the numerical and alphabetical order of the GUIDs that reference each CSE in the Registry, with one exception – Administrative Templates always goes first. Citrix policies are third in the list, which is quite fortunate if you’re leveraging them. Don’t think you can just change the GUID to make it execute before other CSEs – I’ve tried this, and it breaks stuff quite spectacularly.
CSE processing order
Administrative templates
GUID: 35378EAC-683F-11D2-A89A-00C04FBBCFA2
Wireless Group Policy
GUID: 0ACDD40C-75AC-47ab-BAA0-BF6DE7E7FE63
Citrix Group Policy
GUID: 0D0C7034-2EBD-4A87-A9B9-9015E3F2E6E0
Group Policy Environment
GUID: 0E28E245-9368-4853-AD84-6DA3BA35BB75
Central Access Policy Configuration
GUID: 16BE69FA-4209-4250-88CB-716CF41954E0
Group Policy Local Users and Groups
GUID: 17D89FEC-5C44-4972-B12D-241CAEF74509
Group Policy Device Settings
GUID: 1A6364EB-776B-4120-ADE1-B63A406A76B5
Folder Redirection
GUID: 25537BA6-77A8-11D2-9B6C-0000F8080861
Citrix Profile Management
GUID: 26F29E43-DA55-459d-A045-5FEB25F8AB15
Microsoft Disk Quota
GUID: 3610EDA5-77EF-11D2-8DC5-00C04FA31A66
Group Policy Network Options
GUID: 3A0DBA37-F8B2-4356-83DE-3E90BD5C261F
QoS Packet Scheduler
GUID: 426031c0-0b47-4852-b0ca-ac3d37bfcb39
Scripts
GUID: 42B5FAAE-6536-11d2-AE5A-0000F87571E3
Remote Desktop USB Redirection
GUID: 4BCD6CDE-777B-48B6-9804-43568E23545D
Internet Explorer Zonemapping
GUID: 4CFB60C1-FAA6-47f1-89AA-0B18730C9FD3
RemoteApp and Desktop Connections
GUID: 4D2F9B6F-1E52-4711-A382-6A8B1A003DE6
Work Folders
GUID: 4D968B55-CAC2-4FF5-983F-0A54603781A3
Group Policy Drive Maps
GUID: 5794DAFD-BE60-433f-88A2-1A31939AC01F
Group Policy Folders
GUID: 6232C319-91AC-4931-9385-E70C2B099F0E
Group Policy Network Shares
GUID: 6A4C88C6-C502-4f74-8F60-2CB23EDC24E2
Group Policy Files
GUID: 7150F9BF-48AD-4da4-A49C-29EF4A8369BA
Group Policy Data Sources
GUID: 728EE579-943C-4519-9EF7-AB56765798ED
Group Policy Ini Files
GUID: 74EE6C03-5363-4554-B161-627540339CAB
Windows Search Group Policy Extension
GUID: 7933F41E-56F8-41d6-A31C-4148A711EE93
Internet Explorer User Accelerators
GUID: 7B849a69-220F-451E-B3FE-2CB811AF94AE
Security
GUID: 827D319E-6EAC-11D2-A4EA-00C04F79F83A
Deployed Printer Connections
GUID: 8A28E2C5-8D06-49A4-A08C-632DAA493E17
Group Policy Services
GUID: 91FBB303-0CD5-4055-BF42-E512A681B325
Group Policy Folder Options
GUID: A3F3E39B-5D83-4940-B954-28315B82F0A8
Group Policy Scheduled Tasks
GUID: AADCED64-746C-4633-A97C-D61349046527
Group Policy Registry
GUID: B087BE9D-ED37-454f-AF9C-04291E351182
802.3 Group Policy
GUID: B587E2B1-4D59-4e7e-AED9-22B9DF11D053
Windows To Go Startup Options
GUID: BA649533-0AAC-4E04-B9BC-4DBAE0325B12
Group Policy Printers
GUID: BC75B1ED-5833-4858-9BB8-CBF0B166DF9D
Windows To Go Hibernate Options
GUID: C34B2751-1CF4-44F5-9262-C3FC39666591
Group Policy Shortcuts
GUID: C418DD9D-0D14-4efb-8FBF-CFE535C8FAC7
Microsoft Offline Files
GUID: C631DF4C-088F-4156-B058-4375F0853CD8
Software Installation
GUID: C6DC5466-785A-11D2-84D0-00C04FB169F7
TCPIP
GUID: CDEAFC3D-948D-49DD-AB12-E578BA4AF7AA
Internet Explorer Machine Accelerators
GUID: CF7639F3-ABA2-41DB-97F2-81E2C5DBFC5D
IP Security
GUID: E437BC1C-AA7D-11D2-A382-00C04F991E27
Group Policy Internet Settings
GUID: E47248BA-94CC-49c4-BBB5-9EB7F05183D0
Group Policy Start Menu Settings
GUID: E4F48E54-F38D-4884-BFB9-D4D2E5729C18
Group Policy Regional Options
GUID: E5094040-C46C-4115-B030-04FB2E545B00
Group Policy Power Options
GUID: E62688F0-25FD-4c90-BFF5-F508B9D2E31F
Audit Policy Configuration
GUID: F3CCC681-B74C-4060-9F26-CD84525DCA2A
Group Policy Applications
GUID: F9C77450-3A41-477E-9310-9ACD617BD9E3
Enterprise QoS
GUID: FB2CA36D-0B40-4307-821B-A13B252DE56C
ProcessConnectivityPlatform
GUID: FBF687E6-F063-4D9F-9F4F-FD9A26ACDD5F
Group Policies can be filtered in many different ways, in order to make their targeting more granular. Each of these filters can affect the processing time, and again, we will talk more about this as we move on.
Finally, let’s not forget about “loopback processing”, which is commonly used in EUC environments and which allows user GPO settings to be applied based not on the user itself, but to the user based around the computer that they are logging in to. For instance, if you wanted a user to have a branded desktop background on their laptop/desktop but to have a blank desktop background on an RDSH server when accessing it, you would use loopback to achieve this.
Baselining our user GPO processing
Obviously, only user GPOs are processed at logon time. Computer GPOs apply at startup and then at a specified refresh interval, or when a refresh is manually initiated (either by gpupdate or via GPMC). User GPOs apply when a user logs on and also at the specified refresh interval (and can also be manually initiated in the same fashion). As far as our logon time KPI is concerned, we fetch and process all user GPOs that are applied to the user object during logon, and if loopback processing is in use, we fetch and process all user GPOs applied to the computer object (if it is in Replace mode), or all user GPOs applied both to the computer and user object (if it is in Merge mode).
Let’s start by taking a baseline. I’ve exported and applied a handful of user GPO settings to my machines that I lifted from a fairly problematic GPO environment. Now, let’s perform ten logons to a Windows 10 machine via Citrix that we have in my lab. This is where we’re going to see some more goodness from uberAgent – allowing us to break down the Group Policy processing in a very detailed fashion to see how long it is taking to process.
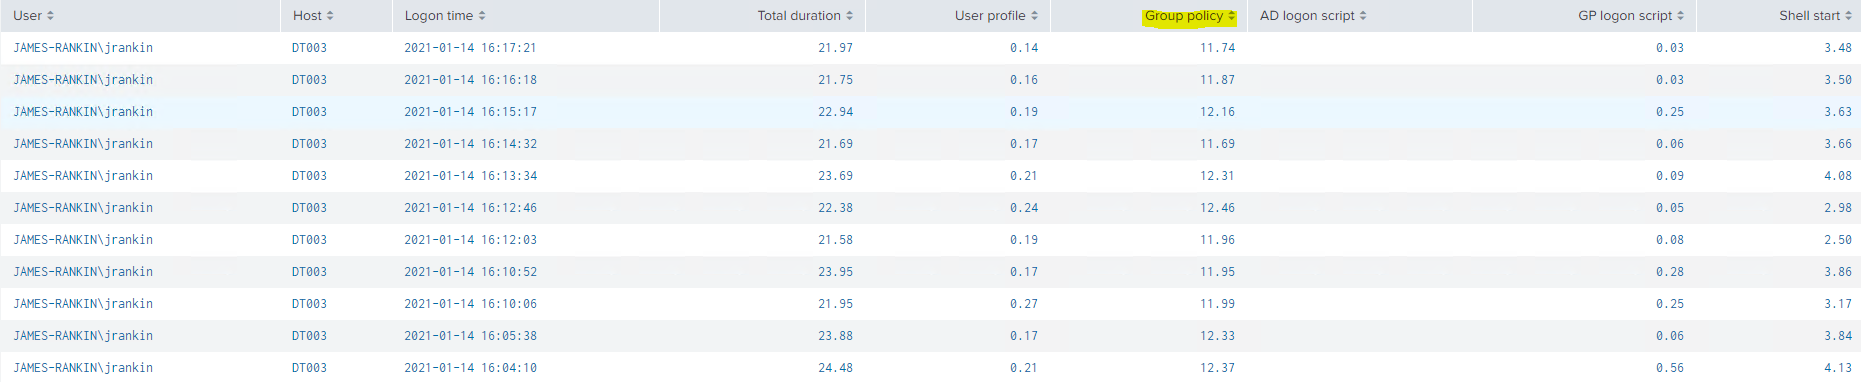
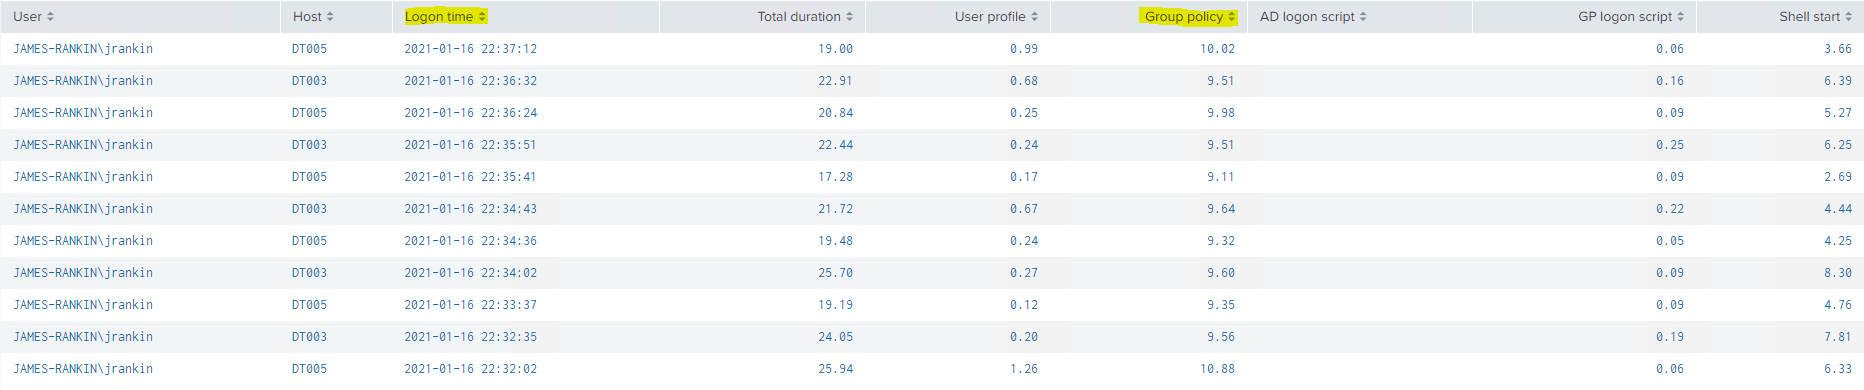
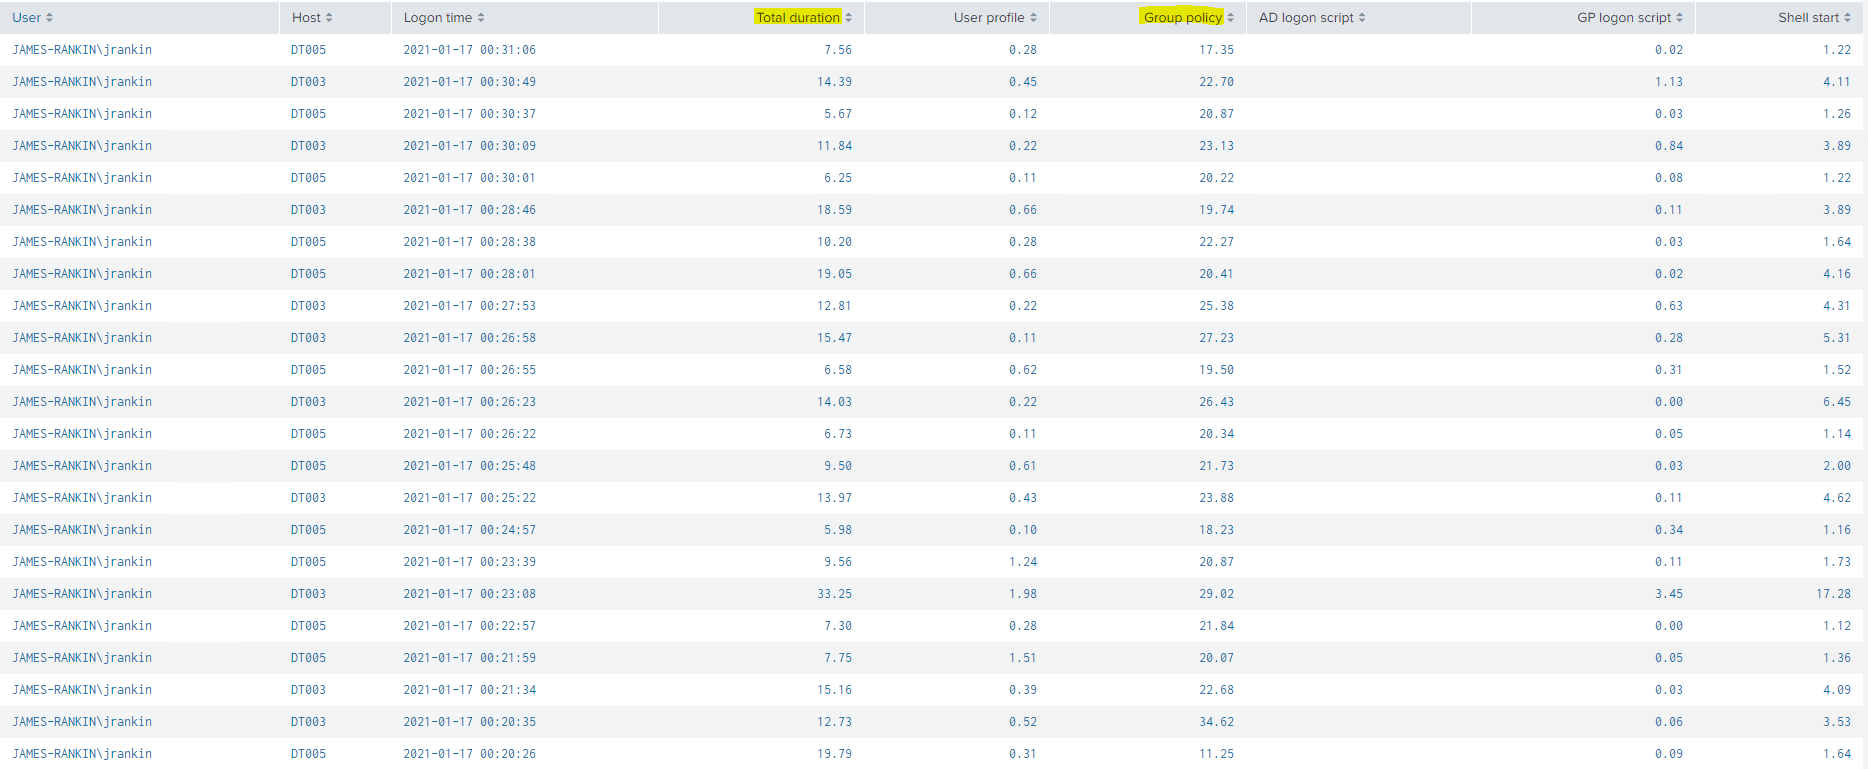
After ten subsequent logons, we have our data showing (which we have nicely filtered down in uberAgent by the hostname and the username)
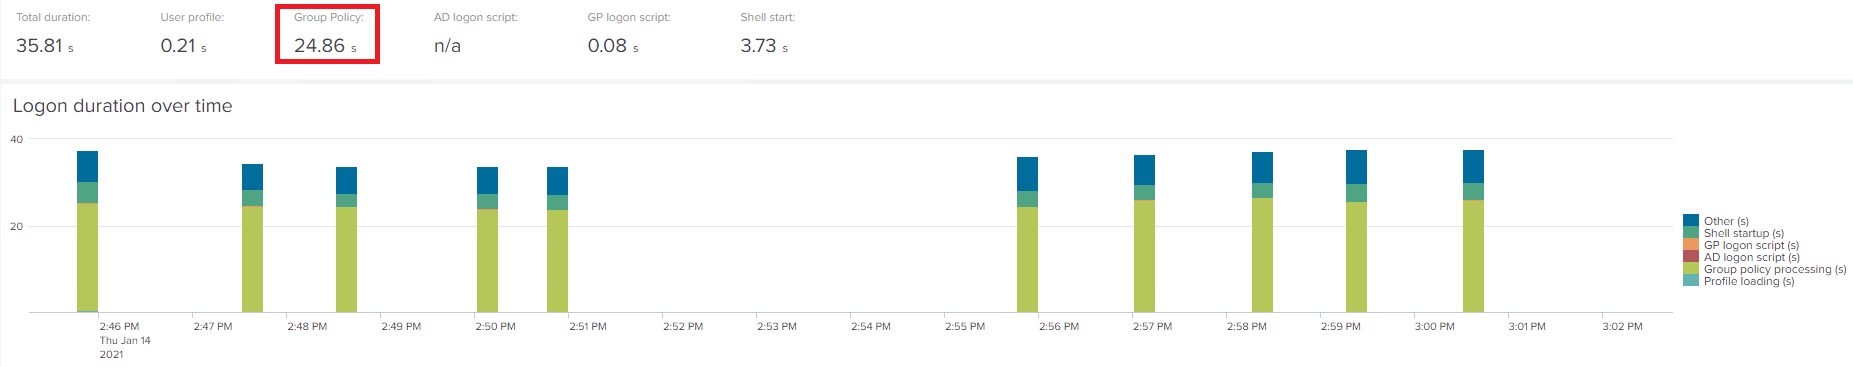
You can see from uberAgent’s handy colour coding on the right that the lime green section represents the user Group Policy processing. It’s quite a significant percentage of the logon, as you can see, and the user GPO processing is taking quite a long time, certainly compared to what I normally see in my lab.
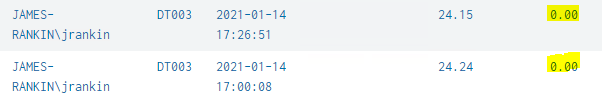
The raw data is below, and you can see that the total processing time is fixed at around 23-26 seconds (average of 24.86 as above).
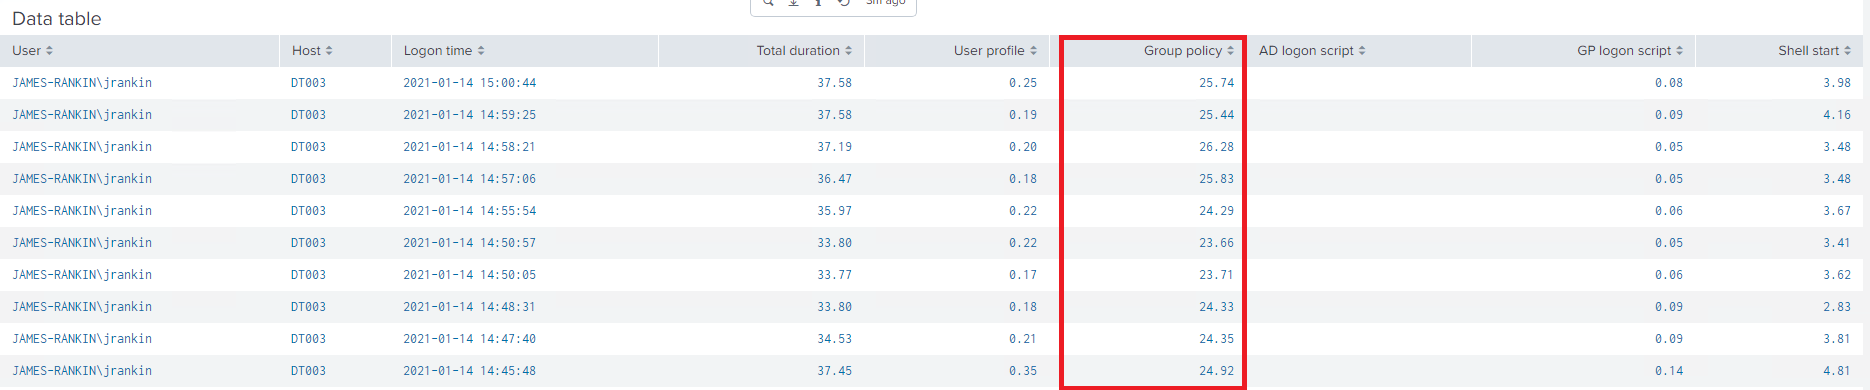
Of course, that just shows us the total time. We know that user GPO processing is done by loading individual CSEs and applying them. So can we break it down any further?
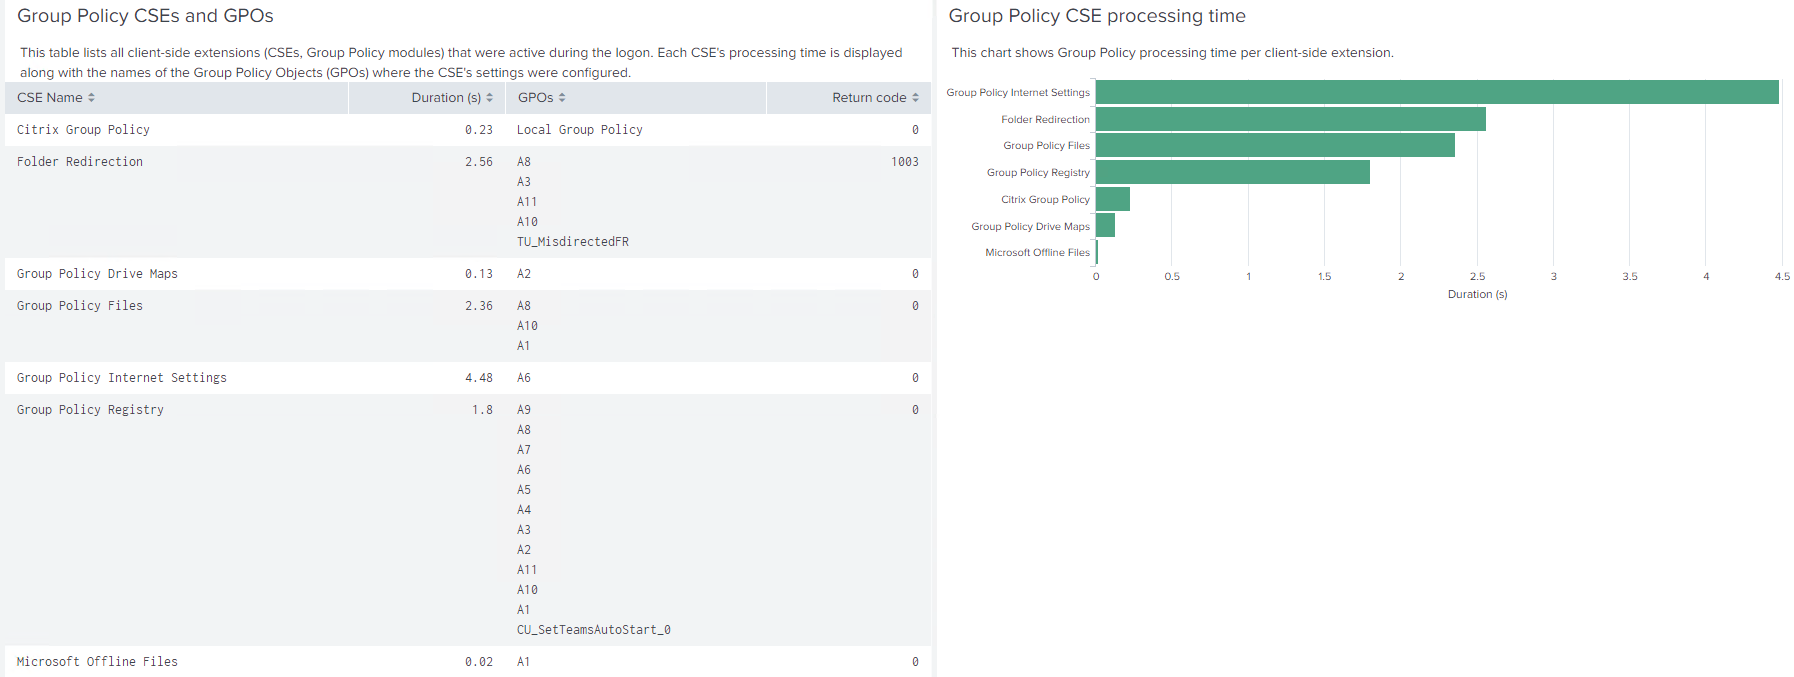
Well naturally, uberAgent provides this detail by having a separate view you can look into, called Session | User Logon Duration | Group Policy. As you can see below, this time the colour coded breakdown refers to individual CSEs.
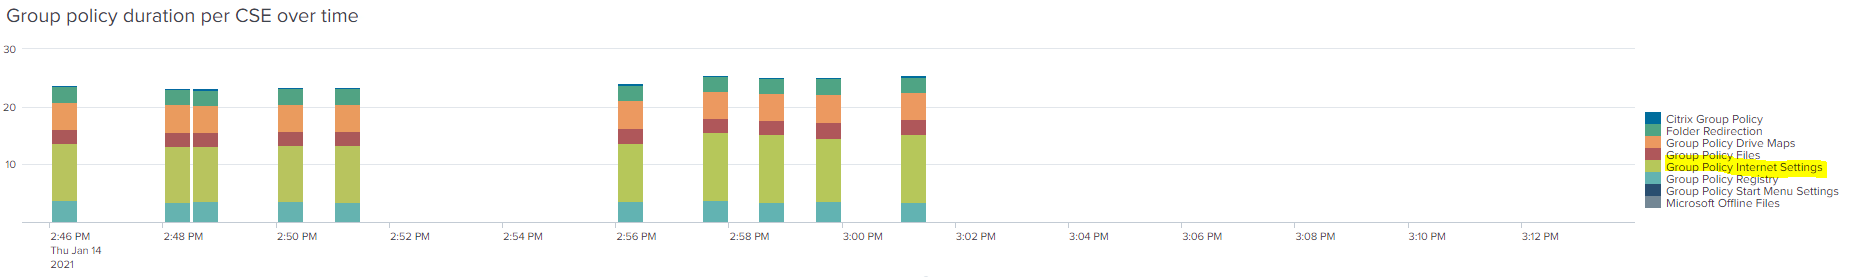
We can see from this pretty much that the lime green section is taking up the most time, and the legend tells us straight away that this is the “Internet Settings” CSE. Actionable data, instantly – that’s what we like!
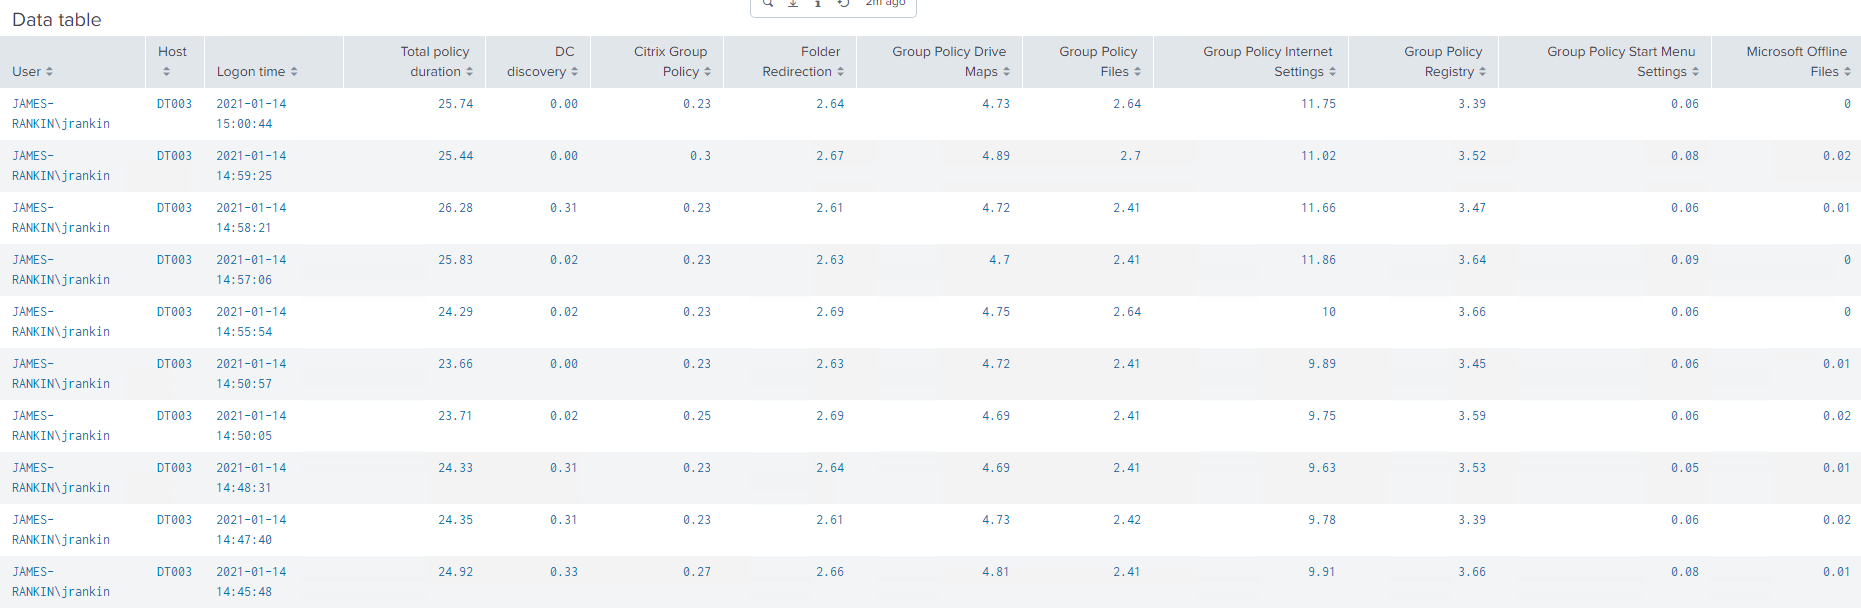
The raw data shows us the time taken for each CSE and the total as well. It also shows us the amount of time that the discovery of a domain controller took, so if there was an issue contacting a DC, we would see it here.
You can get even more data by drilling down into any one of the logons displayed here. This will give you an overview of the CSE, the time taken and also the names of the actual policies that were processed, which is great, as anyone who has spent ages poring through the output of gpresult will happily tell you.
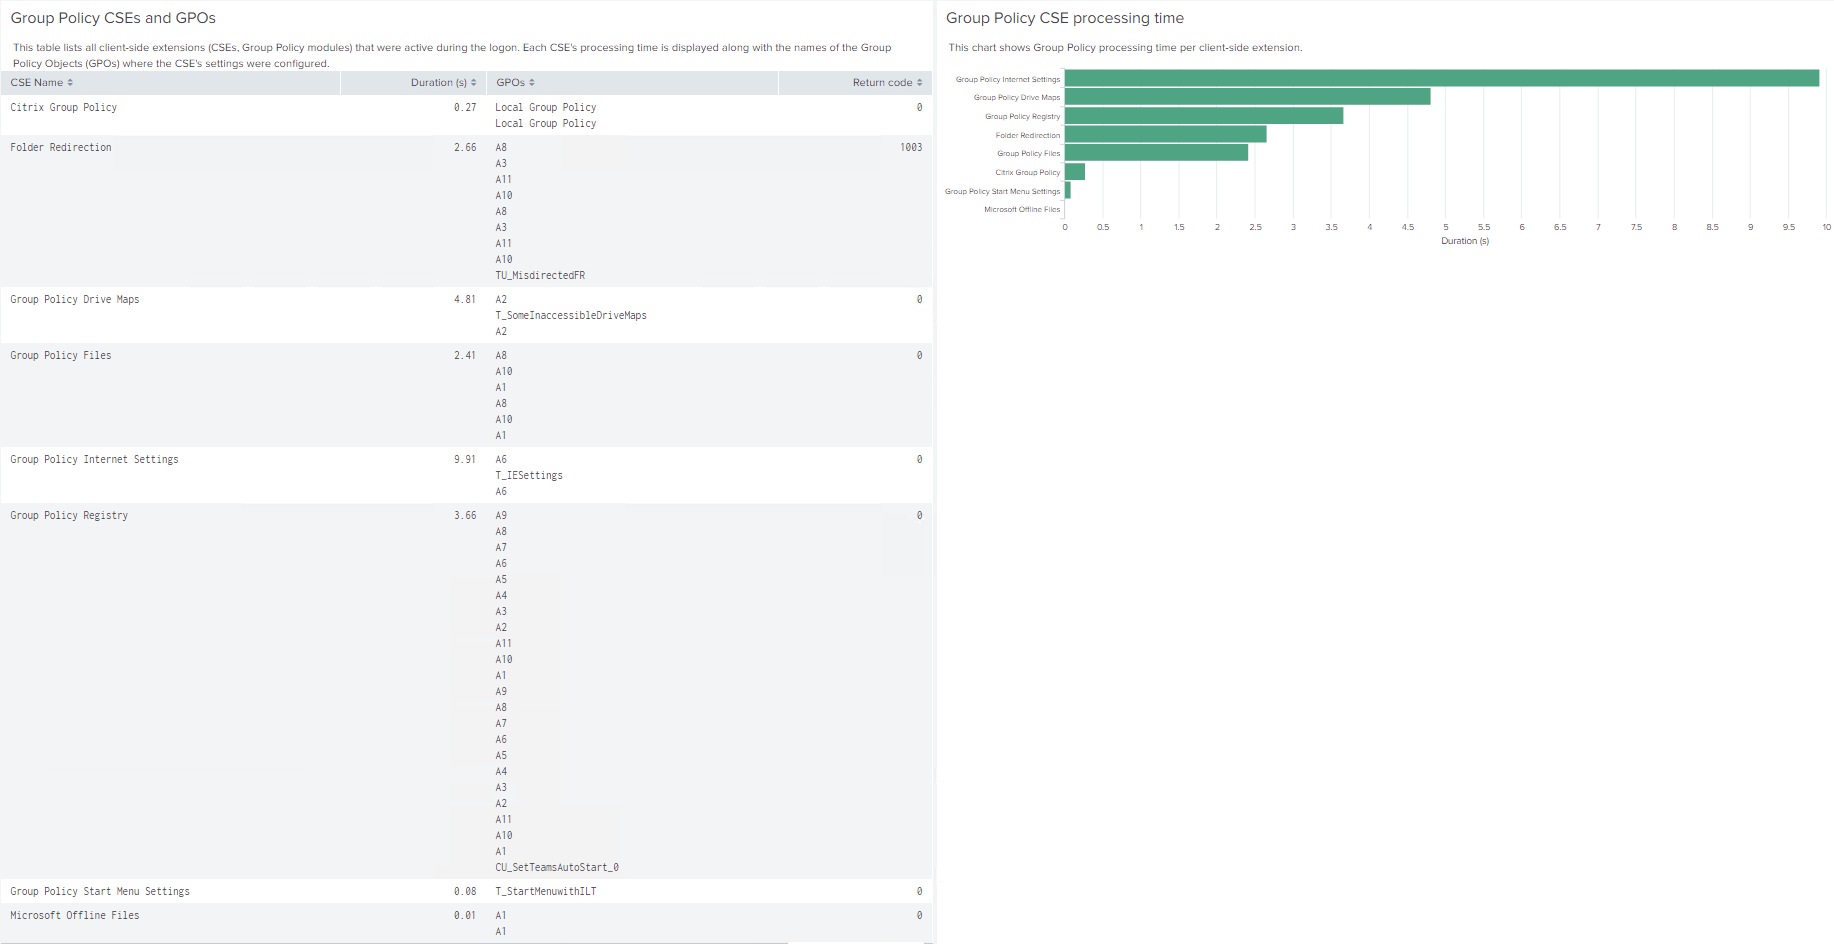
You should be able to see straight away that a lot of my GPOs have silly names in the format of Ax. This is just because I needed to import them quickly and didn’t take the time to give them relevant naming formats. You can also see that a lot of them appear to be applied twice. This is deliberate – we will talk more about this in a bit. You may also notice that many of the GPOs are invoked from multiple CSEs. Again, we will discuss this more later.
So we have a pretty solid baseline of around 25 seconds for our user GPO processing. There are many documented ways to bring down your processing time for GPOs. We will now start to use some of these and test how much difference they make to the sessions in my lab. After each set of tests against an optimization, we will roll back the changes we made, so that we can assess the impact of each optimization against the established baseline. Right at the end, we will apply all of the optimizations together, so we can see the total of processing time it is possible to save.
Policy status
Now, it’s been commonly believed that changing the “GPO Status” of a policy object can make a difference to the overall processing time. The idea is, for GPOs that are User Configuration items, you set the Status (shown below) to “Computer configuration settings disabled”. This means that it only processes one set of configuration items, and processes faster.
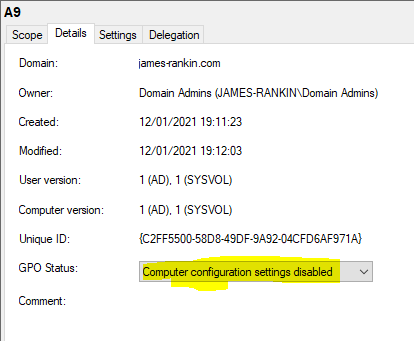
Let’s actually set all our user configuration GPOs to a Status of “Computer configuration settings disabled” and see if we get any better results from ten logons.
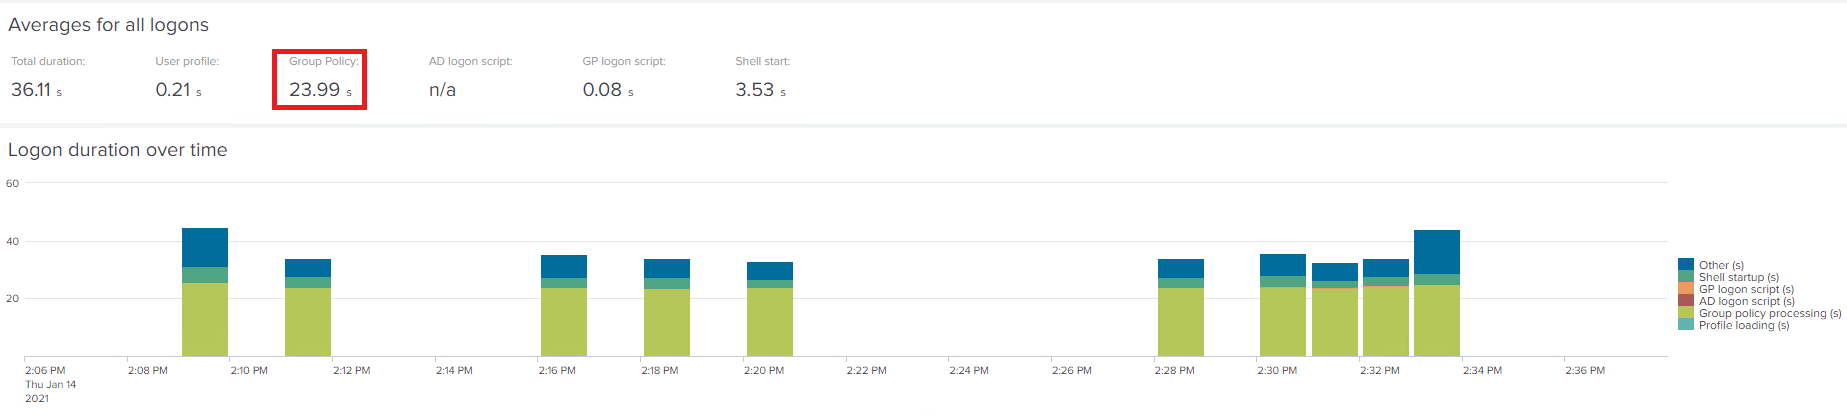
Here’s our average:-
And here’s the raw data:-
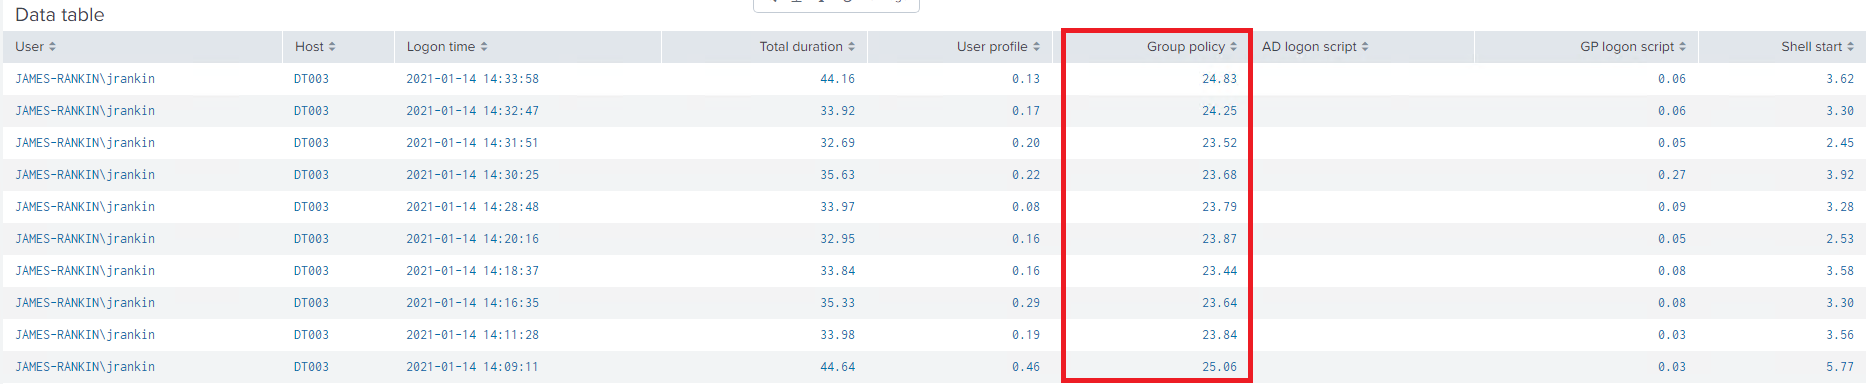
So what’s the conclusion? There is a very slight improvement. We’ve gone from average GPO processing time of 24.86 seconds to 23.99 seconds. As an overall logon time, we’ve improved from 36.1 seconds to 35.8 seconds. Nothing to really write home about, and certainly not anything users would notice, but it nevertheless is a very slight improvement.
The question you have to ask is the overhead of splitting out all your policies into User and Computer configuration items is going to be worth the small amount of logon time that is saved. I’ll probably refer you back to part #1 of this series, where we talk about the industry vertical and the importance of that logon time KPI. You also need to take into consideration the possible impact this might have on how your GPOs are set up with regard to CSEs per policy, which we will talk more about a bit later.
Changing the GPO Status is probably only of use if you need to save every possible millisecond of logon time.
Loopback policy processing
We mentioned earlier about loopback, and I also mentioned that the uberAgent detailed data was showing some of my policies being applied twice. This was deliberate to show the potential impact of loopback processing.
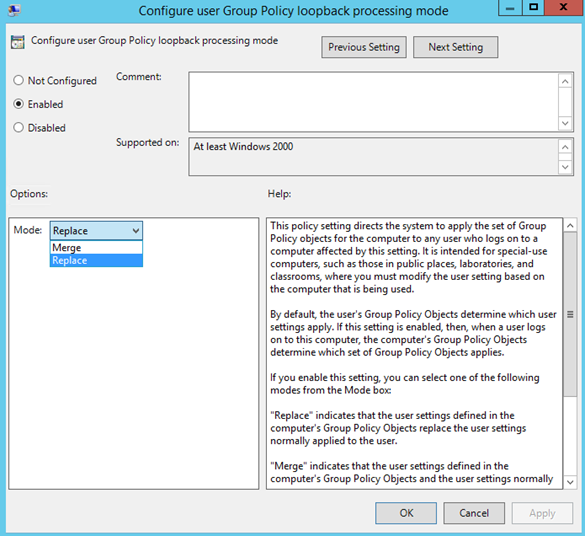
How loopback works is that it is processed in either “Replace” or “Merge” mode. Merge mode takes the user configuration settings from the user object and applies them, then takes the user configuration settings from the computer object and applies them. If any settings conflict, the user settings from the computer object take precedence. In Replace mode, the user settings from the user object are ignored and just the user settings from the computer object are applied. So Merge mode requires two passes to process the user objects – Replace mode requires just one.
In the first set of logons, we had loopback configured in Merge mode. Now we are going to switch to Replace mode and repeat the test of ten logons again. Here’s the average data:-

And here are the raw statistics:-
You can see straight away that switching to Replace mode has made a huge difference. If we dig into the details of a full logon, we can see that the GPOs are now only being processed once:-
In conclusion, we can see that switching from Merge to Replace mode makes a very big difference. We’ve gone from an average logon time of 35 seconds down to 22, and the total GPO processing time has gone from 24 seconds down to 12.
This is a huge improvement, but it’s not necessarily indicative. For starters, many of you may be sensible enough to use Replace mode already, and I’m pretty sure you won’t have deliberately linked the same user GPOs on the user object as you have onto the computer object as I’ve done here just to show what can happen. However – using Replace mode instead of Merge mode removes an entire “pass” of user GPO processing, so I’d always expect it to have a net beneficial effect unless you’re in an environment where no GPOs are configured on the user object.
Ideally, you should always use Replace mode for loopback policy processing unless you have a very good reason not to.
Group Policy caching
Group Policy caching is a feature which involves making the user GPOs available from the local user profile, rather than pulling them all directly from a domain controller. (It also, obviously, does the same with computer GPOs by storing them in the SYSTEM32 folder). However, it does not provide “offline” capability – it simply means during foreground synchronous processing (which is typically what happens during logon, although not necessarily), the policy objects can be read from a local cache rather than the SYSVOL on a domain controller . It operates on Windows 8.1/Server 2012 R2 or higher
GPO caching is normally enabled by default, but it can be disabled by setting Computer Configuration | Admin Templates | System | Group Policy | Configure Group Policy Caching to Disabled. In my initial baselining, I had turned off GPO caching, so now we are going to turn it back on and see what difference it makes to our logon test.
Bear in mind, though, that caching is only enabled by default on client OSes. If you wish to turn it on for RDSH servers, set the GPO in Computer Config | Admin Templates | System | Group Policy | Enable Group Policy caching for servers
Here’s the initial data – and I must apologize for accidentally doing thirteen logons instead of ten, because I lost count after stopping for my tea halfway through 🙂
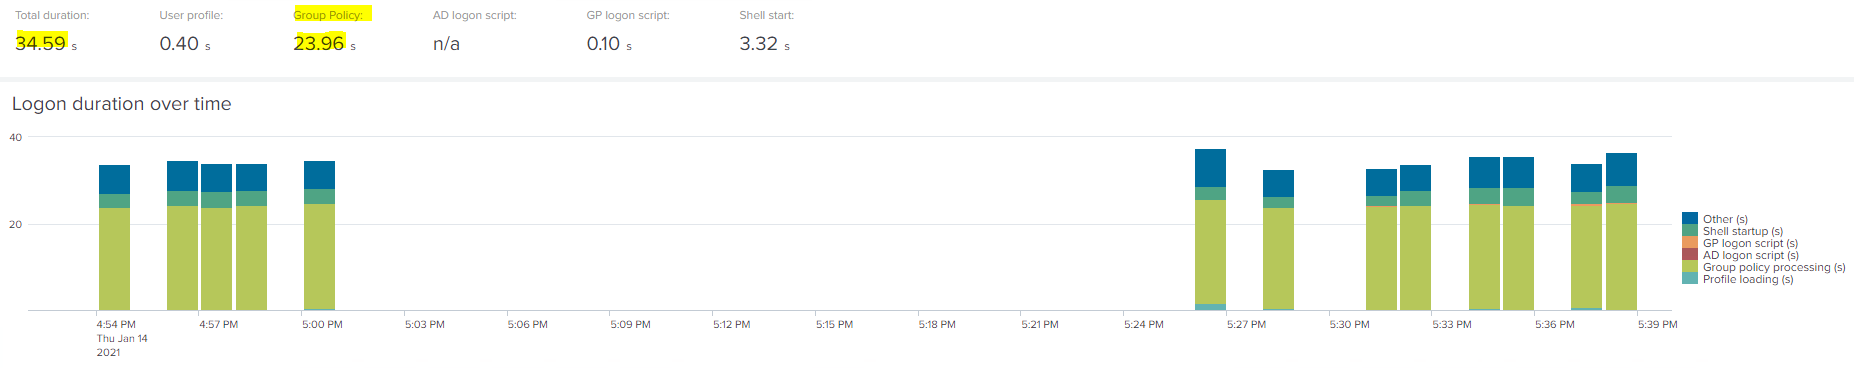
The full data is below:-
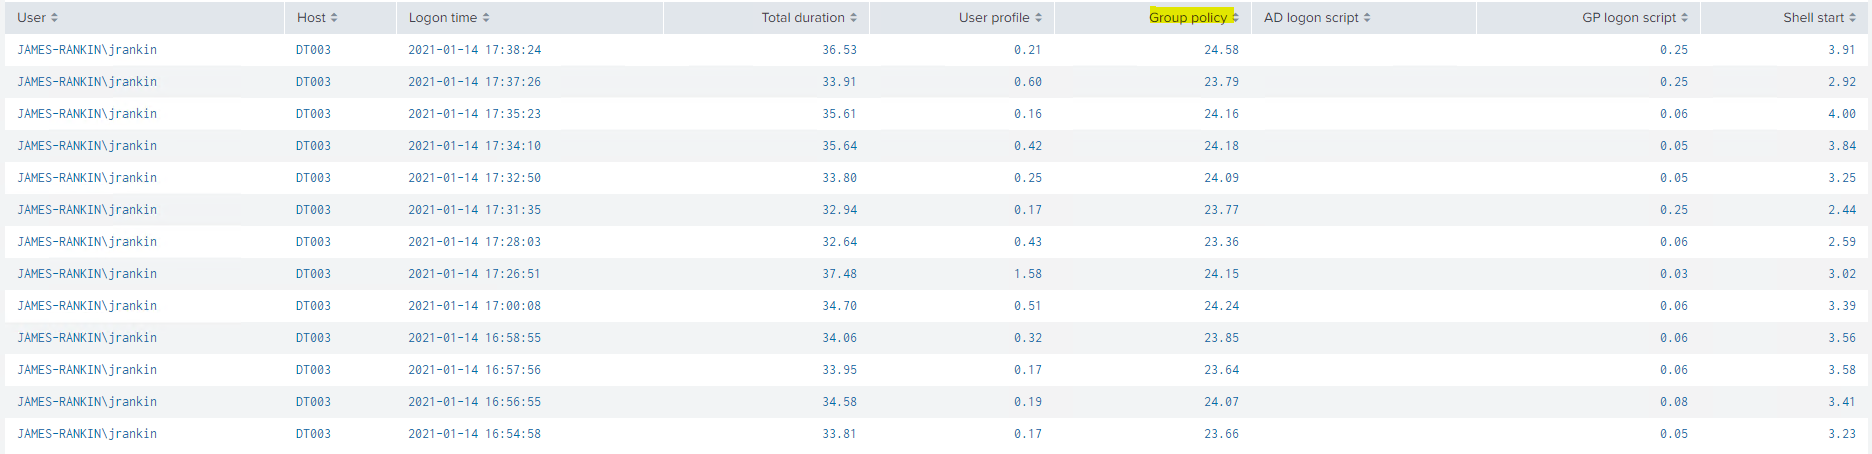
How much of a difference has caching made? We’ve taken the logon from an average of 35.8 seconds down to 34.59, and the Group Policy processing itself has dropped from 24.86 seconds down to 23.96 seconds. Not really much, in terms of impact.
One thing we have noticed, though, is that in our baseline testing the DC discovery occasionally took 0.3 seconds, whereas with GPO caching available, it is mainly (although not exclusively) down to 0.0 seconds. I’m not sure whether this means it simply didn’t have to contact a DC at all, or whether the DC response time was so quick as to not be registered.
Again, the apparent low impact of turning on GPO caching has to be measured against the environment you’re in. As far as the lab goes, I never have any contention or network issues with my domain controllers. In an enterprise environment, you may see much better results from GPO caching, although if you are on a modern version of Windows it is pretty likely to be on by default. In my environment, the response time of a DC against that of the local cache is in the main unlikely to be hugely divergent.
It’s also worth mentioning about how GPO caching behaves, especially in non-persistent environments like RDSH. As well as the actual cache files within the user profile in %LOCALAPPDATA%\GroupPolicy\DataStore (which you will need to be careful not to exclude from any profile management solution you are using), there is a reference to these files contained inside an HKLM Registry key – HKLM\Software\Microsoft\Windows\CurrentVersion\Group Policy\DataStore\[USERSID]\0, where USERSID equates to the user’s SID. So in RDSH or non-persistent VDI where users can potentially hit multiple machines, caching may not even function correctly unless you can also persist this HKLM Registry value along with it. Rather than go into the details of that now, I am going to save up “persisting GPO cache on non-persistent machines” as a future blog article subject.
So should we turn on GPO caching?
If you don’t have GPO caching turned on (usually if you are using RDSH), then yes, it can’t hurt. But it won’t make a huge difference unless you typically see slow performance and response from your domain controllers.
GPO filters
Now we will talk about filters. In GPOs, there are three types of filter you can apply. There is a standard Security Filter, WMI filters, and Item-Level Targeting which is only available through the Group Policy Preferences CSEs.
Security filters
GPO security filters simply apply NTFS permissions to the files and folders that make up the policy objects, so if the user or computer has no access, the files can’t be fetched. For our first test here, we will apply a security filter to all of our user GPOs and see what the processing time is like. Interestingly, we are looking for an adverse, rather than a positive effect here – we are seeing if applying filters has a net negative effect on policy processing time.

Remember that you must add Domain Computers or specific computer objects to user GPOs as well as the user objects when you are using security filtering, as part of the processing is done in the computer context. This was a security change introduced a good few years back.
Let’s now repeat our logon test and see what has happened.

Oddly enough, for the first ten logons, we saw a very slight improvement (24.13 seconds average as opposed to the baseline of 24.86), so we removed the security filter and performed another three logons afterwards – and the performance remained pretty much the same (24.23 average), leading us to conclude that we were seeing a very slight improvement from something in the background outside of our testing scope. But we can safely conclude that security filtering has no adverse effect.
WMI filtering
You can also apply WMI filters to GPOs, and if the WMI query returns false, the files for the CSE will not be fetched. There is a huge amount of data you can query using WMI, so I don’t want to start getting into testing all of them. For the sake of keeping this article down in size, we’re going to test a standard OS/architecture filter (probably the commonest out there) and then something a bit more off-the-wall.
Let’s apply a standard Windows 10 x64 OS filter

And now let’s get back testing again

There is a slight uptick from the Windows 10 WMI filter – but it’s absolutely minimal. 24.86 seconds to 24.91 is not something we should be worried about, even in a vertical where logon times are crucial. We can safely say that using OS and architecture-based WMI filters won’t affect your logon time KPIs. Don’t forget a WMI filter is run once for each GPO it is associated with, so this one has run about ten times and only increased processing very slightly indeed.
A slight optimization you can apply to your WMI filters is to use the actual attribute rather than using a wildcard to query an entire class. So for instance, if you were querying whether the architecture was x64, you might think to use this
select * from Win32_OperatingSystem where OSArchitecture = '64-Bit'but it would actually be processed slightly more efficiently if you were to word it like this instead
select OSArchitecture from Win32_OperatingSystem where OSArchitecture = '64-Bit'Now let’s try something a bit more exotic in our testing – a WMI query to see if Internet Explorer 11 is installed. The WMI query is below
SELECT path,filename,extension,version FROM CIM_DataFile WHERE path="\\Program Files\\Internet Explorer\\" AND filename="iexplore" AND extension="exe" AND version>"11.0"How will this fare? Let’s see…
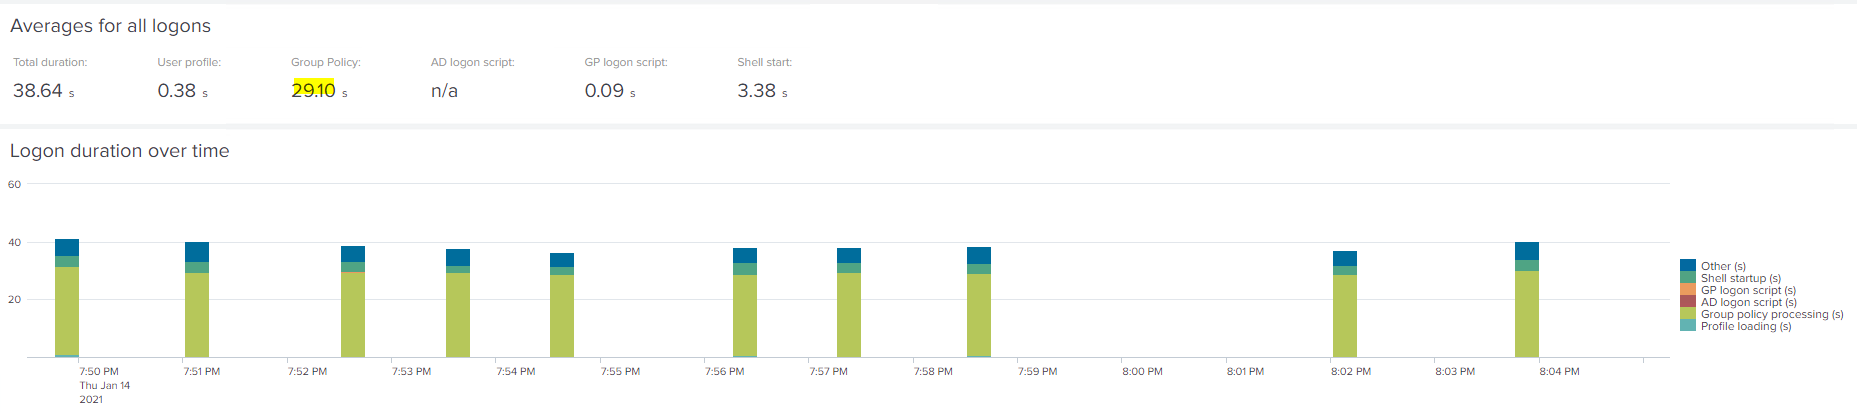
Now we can observe a fairly significant uptick in GPO processing time – from 24.86 seconds so 29.1 seconds. Not good!
The effects of your WMI filter clearly vary widely depending on what you use. The WMI filter is queried for each GPO that it applies to (about ten in this instance), so if you need to use them, the section on consolidating CSEs may further help you here. What you need to do is assess the performance of your individual WMI filter and then take into account how many times it will be run during user GPO processing, to get an idea of how much impact it may have. Coincidentally, Helge Klein (who is also the creator of the uberAgent product) has a blog article discussing how to monitor WMI processing time which may prove very useful here.
I think that as long as they are kept straightforward, WMI filters probably don’t deserve the reputation they have for an impact onto logon times.
Item-Level Targeting
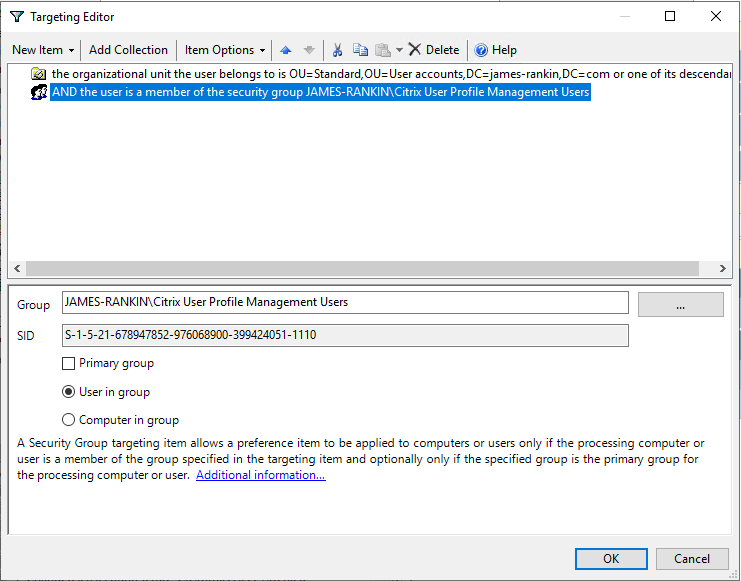
Item-Level Targeting (ILT) applies specifically to the CSEs that are available through Group Policy Preferences. As with WMI filters, there are many options you can select here. I may do a slight addendum to this article in future where we test the impact of each ILT option and combinations of options, but for now, we will take some commonly-used ones as a yardstick. As an aside, in the image below showing all the possible ILT options, you’ll notice it also includes WMI capability here as well.

Now, the GPOs we have imported contain some ILT settings already – a mix of security group lookup and OU lookups. So for the first test, I’m going to add ILT settings to every GPO that is applying instead of just a few of them – go for full ILT overkill, but keep it to commonly-used settings.
Let’s see if going ILT-mad makes much of a difference to our testing data…
Well, we saw some really interesting results here, and so strange, that we opted to try to make some adjustments to the environment during the testing to see what happened. After adding the ILTs initially, we saw a big jump (to over 50 seconds) for the Group Policy processing time. However, on the subsequent logons, it went back to normal. So we added more ILTs – and the next logon jumped again, before settling back down. Wondering if this was just because the GPOs had been modified when I added more ILTs, for the next test I simply renamed some of the GPOs and added some new settings, but no new ILTs. However, this time there was no spike in processing time at next logon. It was almost as if once ILTs were processed initially, they were processed much faster next logon, until they were changed.
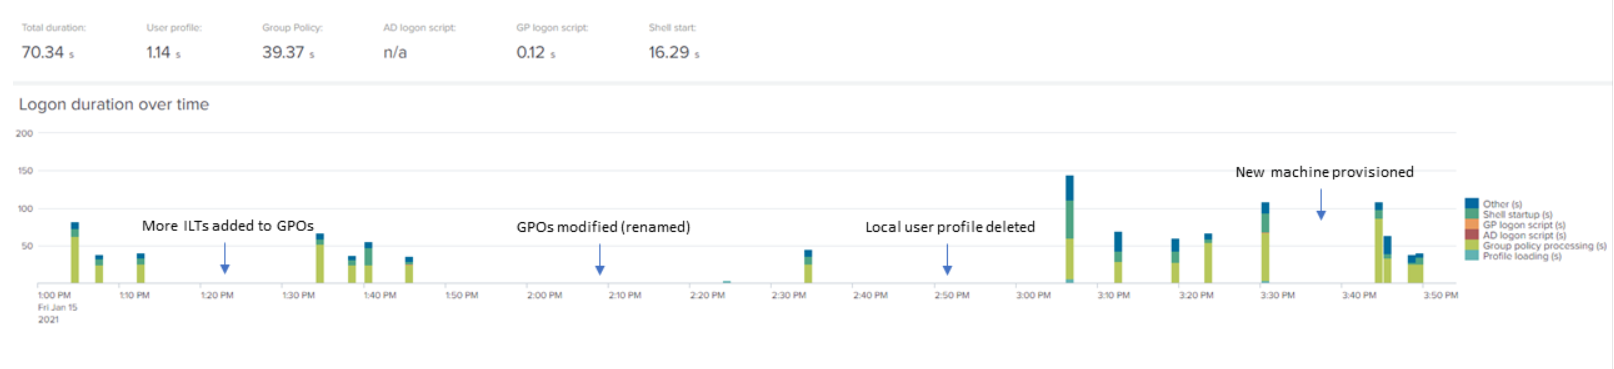
I then removed the local copy of the user profile, and we got a huge spike next time (not unexpected on Windows 10), but interestingly, the GPO processing time was still way up, but settled back down at next logon. So I then provisioned a new machine – and again, there was a big initial spike at the first logon, which settled down afterwards. The data is shown below, along with inserts that show what we did in between tests. Needless to say, the average logon time and GPO processing time is significantly increased in this set of tests, but if we only changed the ILTs once and then performed a hundred logons, then the average would be very close to the baseline.
I’m not entirely sure what to make of this! I know that OU, LDAP, Site and Domain queries in ILT are supposed to involve a call out to the network which can make processing slower, and I deliberately used a lot of OU queries to see if this was accurate. What I see, though, is almost that Item-Level Targeting queries that have a lot of overhead, once they’re run once, seem to be cached somewhere in the user profile and don’t take as long next time – unless the ILT filters are changed, or the user’s profile is deleted or removed, in which case they see an upward spike again. And this is nothing to do with Group Policy caching, either – I made sure that it was turned off and the folders used for it were completely empty.
I did go off and ask Group Policy whiz and PolicyPak author Jeremy Moskowitz about this behaviour, and he told me that it was possibly to do with AD caching. When an object is queried, it is cached locally so any further queries for that object can then be processed by just referring to the local cache. It isn’t specific to the CSE, but specific to the type of AD object being queried for – and this certainly fits, as I went out of my way to use OU, Site and Domain queries. This cache isn’t perpetual, obviously, and I’m not quite clear on the finer points of operation, but it definitely seems to fit with the behaviour I saw from the data within uberAgent. This cache persists as long as you are using a profile management solution, but I didn’t get as far as testing where this cache is located – I captured the entire profile from the root.
I think it is safe to conclude that unlike WMI filters, ILT filters have the capability to really adversely affect logons, but mainly only in certain circumstances. Another interesting point about WMI versus ILT is that if a WMI filter returns false, it will not download the attached policies for processing, but as ILTs are attached to the actual policy objects, the policies themselves must be downloaded before the ILT can be checked. So inherently, WMI filters have less user GPO processing impact than ILTs (unless you use a crazy WMI filter like the Product class).
Also, WMI filters are only processed once per GPO, but ILTs are processed for each setting they are applied to – even if the ILT is identical on each setting inside the GPO. There is a feature called Collections within Group Policy Preferences that lets you apply a single ILT to a group of settings within a GPO – but unfortunately, it is solely available in the Registry CSE, limiting its usefulness.
It’s a bit annoying for me to see the “everything you wanted to know about Windows logons” getting even larger in scope (I started doing this last June!), but I think certainly there is a space for two separate articles discussing the logon impact of WMI filters and Item-Level Targeting in a lot more detail. Big sigh from me as I add them to my OneNote list 🙁
Filtering summary
What conclusions can we draw on filtering? Firstly, that Security Filtering is pretty much non-impactful onto our processing time. Secondly, that WMI filtering isn’t as bad as its reputation suggests – as long as you avoid known bad-performance filters like the Product class. Finally, Item-Level Targeting, whilst very useful for those of you who need to produce very granular or complex filtering easily, can have a detrimental effect on logon times, but this may be limited in terms of both situation and depending on the actual ILT filters that you select. We know that OU, Site, Domain and LDAP queries can have a detrimental effect – and the testing we have done certainly suggests that this is mostly accurate – but the true impact of ILT filters, particularly combined ones, can only be accurately assessed through testing and baselining.
Security Filters are the best, WMI filters are fine as long as they are used wisely, and Item Level Targeting is a very mixed bag.
Network drive mappings
Now, let’s move onto a favourite subject of mine. Drive mappings. I’ve had a rant about drive mappings and their impact onto not just logon but also in-session performance previously. Let’s see if we can recreate it here.
We’ve got a GPO with six (totally invalid) drive mappings listed within it – for our baseline testing, these settings were filtered out using Item Level Targeting. Now we’ve removed all the ILTs, so during the logon, six inaccessible drive mappings will be attempted. Microsoft reckon a maximum timeout of 30 seconds per drive mapping, so potentially, we could be looking at up to three minutes onto our logon time. How long will it take? Let’s find out…
Now, I know I said we’d do ten logons for each test, but this time, I’m just doing one. Why, I hear you ask? Well….
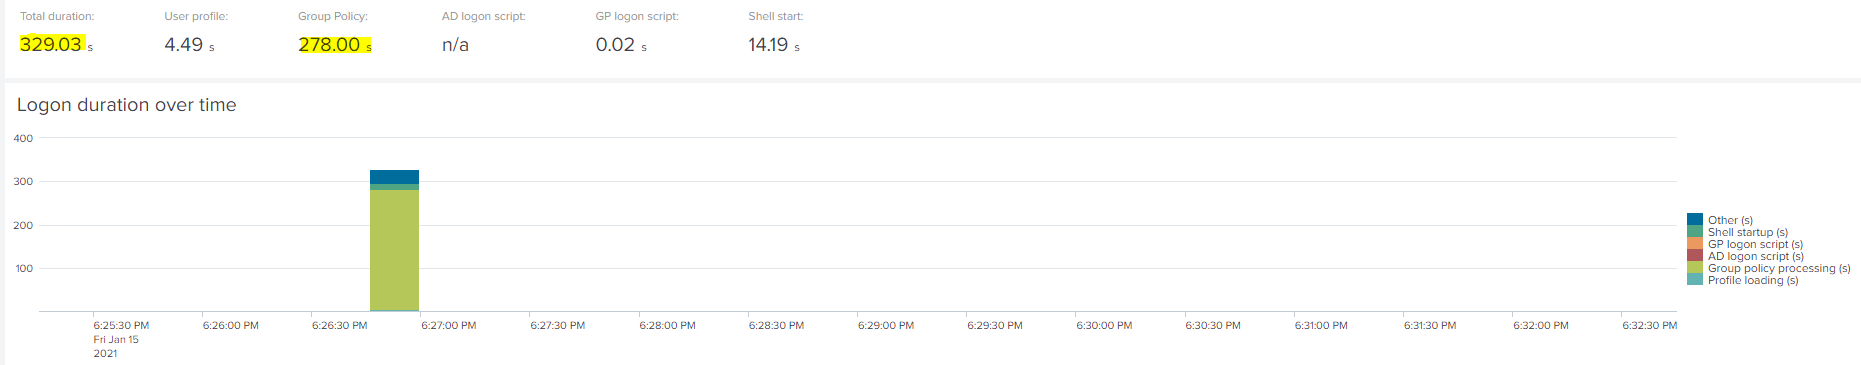
…that’s why. At a total logon time of 329 seconds, and a not-inconsiderable 278 seconds for user GPO processing, that’s an incredible uptick. If you’re in any doubt as to what caused it, then I’m sure uberAgent can give us the breakdown of the GPO process…
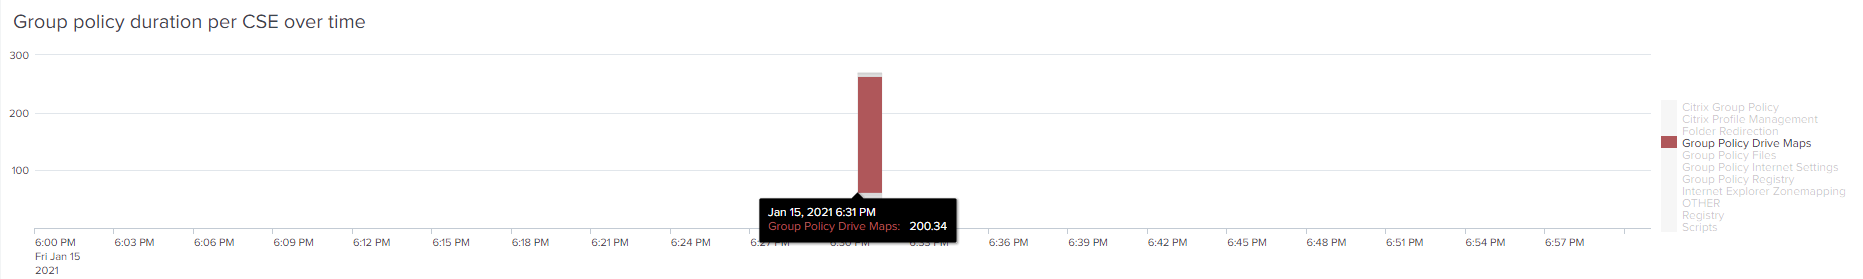
…and quite comprehensively, it’s the GPP Drive Maps CSE that is at fault. At 200.34 seconds for 6 inaccessible mappings, that’s a timeout of about 33 seconds per mapping – so looks like Microsoft’s timeout estimation is reasonably accurate.
“But surely you wouldn’t have six inaccessible drive mappings?” I don’t know, it’s certainly within the realms of possibility. Just for posterity, though, let’s reduce the number of inaccessible drives to one, and run the test again.

It is still pretty much off the charts = 102.3 seconds for the total logon and 83.16 seconds to process GPOs. Digging deeper into uberAgent shows this…
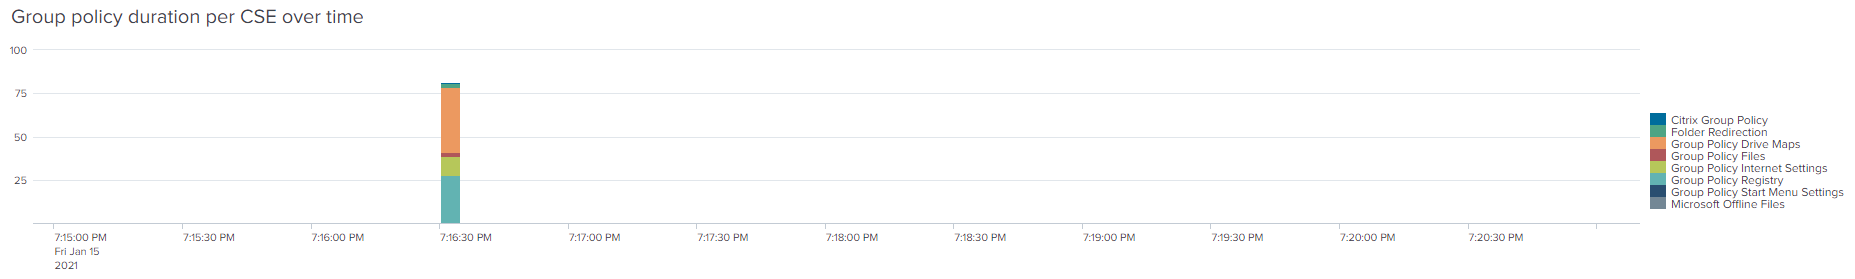

The Drive Map CSE is shown in orange and has taken 37.13 seconds to process, so again, not too far out from Microsoft’s estimations. That’s still really bad.
I’ve said it before and I’m going to say it again – drive mappings, if for some reason they become inaccessible, are really bad for your logon times. I know it won’t happen often, but there’s no reason to insist on them being “mapped” when you can use a shortcut instead which will take a lot less time to deploy even if the destination path is inaccessible.
Drive mappings are the work of the devil. Abandon them.
Asynchronous policy processing
Now, I wrote a blog post previously about enabling asynchronous policy processing. You will get a much better overview if you read the article, but in a nutshell, you can force user GPOs to be processed in asynchronous mode (all together) rather than the standard synchronous mode (one by one).
There are certain caveats to enabling asynchronous policy processing. The user must have logged on to the device previously (but you can get around this, as detailed in the article, by inserting some Registry values into the default user profile). Also, you cannot have asynchronous mode if you are using Folder Redirection policies or Software Installation policies. Software Installation Policies are very rare to see in the enterprise so I’m not too worried about them, but Folder Redirection policies are pretty common. However, if you stop using the actual Folder Redirection CSE, and simply use the Registry Group Policy Preferences to set the required values in HKCU\Software\Microsoft\Windows\CurrentVersion\Explorer\UserShellFolders instead, then you can do Folder Redirection without needing synchronous policy processing. As I said – all the details are in the previous article I linked.
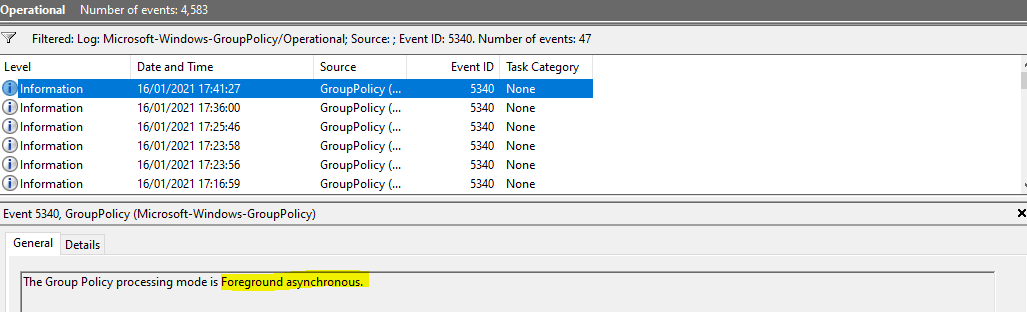
You can tell if a logon was synchronous or asynchronous by checking the event logs. The log you want is Applications and Services | Microsoft | Windows | Group Policy | Operational. Filter the event log by event id 5340 and it will show you the processing mode used. If you do this just after logging on, you can see whether your logon was processed synchronously or asynchronously.
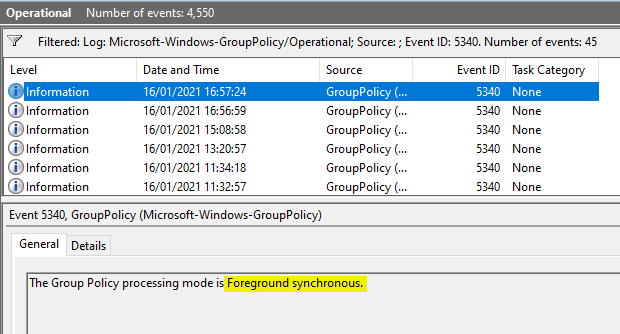
As you can see, the default processing mode for our logon is synchronous, which means GPOs are processed one by one. Can we change this to asynchronous, and how much difference will it make to our established baseline for processing time of 24-26 seconds? We have to disable all of our Folder Redirection policies to make it happen, so we’ve replaced them all with GPP Registry Actions (just setting them to “Not Configured” doesn’t cut it – the Folder Redirection CSE still gets processed, sadly).
The first logon shows as asynchronous, so we know we’ve got it right
Now, let’s complete the ten logons and gather the stats. I’m actually quite pleased to say I anticipated the oddities that would show here, so let me show you the data and explain them.
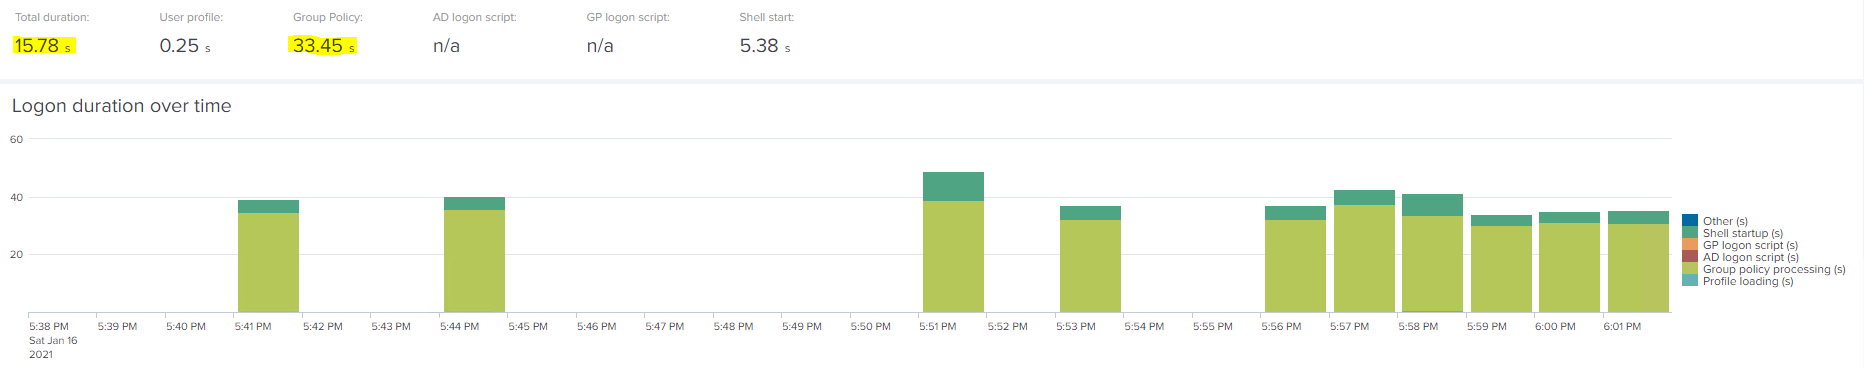
Firstly, you may be saying “well the GPO processing time has gone right up!” Yes, yes it has, from our 25 seconds baseline average to 33.45 seconds. However – take another look, and look at the total logon time on the left. That, conversely, has come way down – in our baseline timings the average total logon time was 35.8 seconds, and now it is down to an amazing 15.78 seconds. But how come the GPO processing time has gone up but the logon time has more than halved?
If you read the article about asynchronous processing, you will notice that this processing mode simply presents the desktop (and therefore completes the logon) while the GPOs are still being processed. So it stands to reason that logon is shorter but the processing time is longer, because the GPOs are not only still being processed but they are now contending with all of the user session processes to finish. So essentially, we’ve given a shorter logon time at the expense of the processing rumbling quietly on in the background. This is what technology like Citrix WEM, Ivanti UWM and a whole ecosystem of other products have been able to do for a while – take logon processes and run them after the user logon has already completed. To be fair – and this is why I made the point in part #1 of this series about “TTOE” – this GPO processing running after logon makes no difference to the usability of the user session, so I have no concerns about taking this much-reduced logon time as a big win.
uberAgent is displaying the data correctly but unfortunately if you just look at the graph, that also takes into account GPO processing as part of the display so it seems that the logons, on the graph display, are longer than previously. I’ve raised this up with them though, so hopefully they should be able to give us a graph that will take into account a logon that is in foreground asynchronous mode.
As with WEM and UWM and other software that can offload in similar ways to this, there are sometimes concerns about “will the GPOs be correctly applied?” It’s true that some GPOs rely on being in the Registry before the shell starts (think File Explorer policies in the main), but in my experience, I’ve never seen any failures that would indicate this is a potential issue. Of course, you should always check and test thoroughly beforehand and verify that your policies are being applied as expected.
Asynchronous policy processing makes a huge improvement to your logon times. If it also means you get rid of Folder Redirection CSEs, then it’s a double win, simple as.
Consolidation of CSEs into single GPOs
For the final testing situation, we will look at the impact of consolidating all your CSEs into single GPOs – so for every CSE you apply to the target area, there should only be one GPO containing them.
You saw earlier that we have a real mixed bag of CSEs across our GPOs – the Group Policy Preferences Registry CSE, for instance, is called from many different policy objects.

The idea is, every setting that calls the GPP Registry CSE should be inside a single Group Policy Object, and so on for all the other CSEs. You can see how this would get complicated, though – don’t forget Administrative Templates is a single CSE, and there are thousands of configuration settings inside there!
We’ve consolidated all of the settings we were applying into a single GPO for each CSE we were using, as you can see below
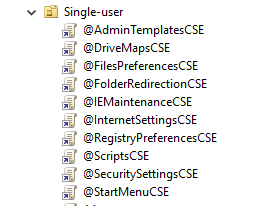
Let’s test this and see what difference it makes.
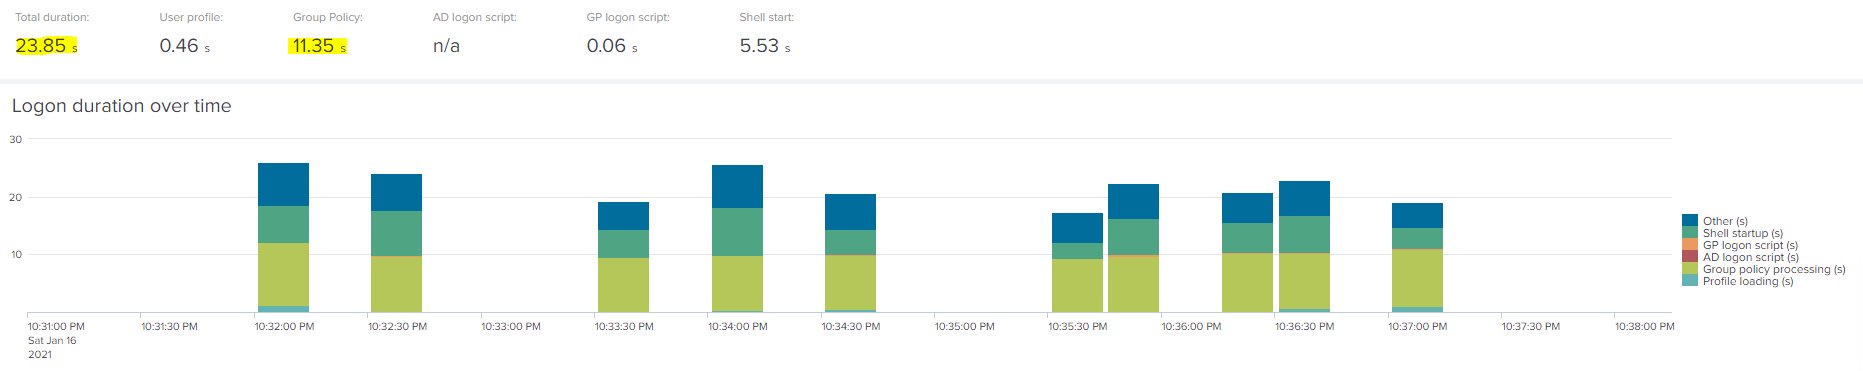
Now these results, I have to confess to being quite astounded by. I deliberately imported a set of GPOs that I knew were complicated, convoluted, and very badly maintained, with settings spread hotch-potch across the various objects mixing up many different CSEs – but I didn’t expect my long, frustrating tidy-up to yield such glaring improvements. We’ve taken the total logon time from 35.8 seconds down to 23.85, and the GPO processing time from an average of 24.86 seconds down to 11.35 seconds. That’s a helluva optimization just by tidying up the CSEs!
Let’s be realistic though – unpicking big enterprise GPO implementations in this way can be very difficult, and often necessitates redesign of OU structures, considerations around filtering, and lots of conversations with security as you try to work out how to keep the mandated policies in place without risk to the business. But honestly, in the wider scope of things, to make this much gain just by applying due diligence and best practice to your deployment is a huge bonus.
Don’t underestimate how much impact badly designed and implemented GPOs can make to your logon times.
Any other tricks?
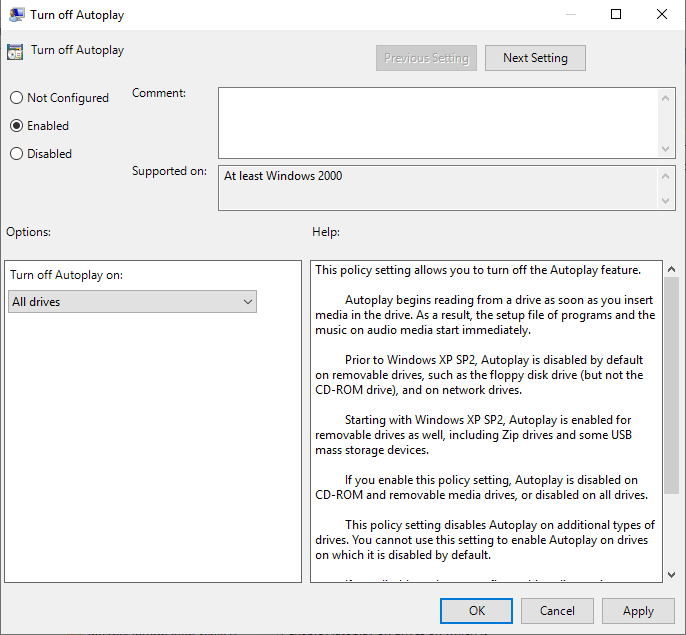
Before we move on to the “summary test”, just a quick mention of other tips I didn’t have time to measure or couldn’t find a way to do it. Firstly, always try and think about Computer GPOs versus User GPOs. If you’ve got any settings that you want to apply to all users including administrators – a good example here is disabling AutoPlay – why would you use the User GPO to enforce this? Many GPO settings are present in both the Computer and User sections, so if it’s a global setting you’re applying, why not use the Computer settings and avoid having to apply them at user logon? It’s a no-brainer.
Also, be aware that lots of user GPO settings sometimes have “undocumented” equivalents at a Computer level. You can sometimes simply find out the Policies key that a setting is written to in the Registry, swap HKCU for HKLM and the policy will actually work! If there’s a conflict between Computer and User settings, bear in mind that the Computer setting always wins.
I may do a further quick article on this in future, as there are a lot of settings that can be moved in this way.
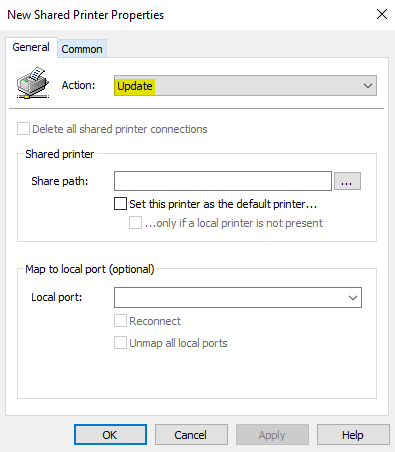
It’s also worth mentioning if you’re installing printers using Group Policy Preferences, don’t use Replace, use Update instead. If you use Replace, the printer driver will be re-downloaded at every logon, potentially bloating out your logon time. As I don’t have a printer, I couldn’t really test this to find out the level of impact, but I have seen it happen in the wild.
If you want to do some more reading on printers, consider having a look at this from the guys over at PolicyPak – https://www.mdmandgpanswers.com/blogs/view-blog/can-you-speed-up-login-times-when-using-gpprefs-printers-deployment-and-does-it-matter
I did consider touching on logon scripts but the impact of a logon script depends very much on what’s written in it and how efficient it is. Personally though, we have so many other tools for environment setup I very much think that logon scripts have had their day – setting up tasks to run a few minutes after user logon is best if you absolutely need to run a script of some sort. Logon scripts are like drive mappings and folder redirection – best put out to pasture.
Putting it all together
So, let’s take that baseline we had – and let’s apply all these GPO optimizations together. What will the final results look like? We’ve applied everything together – asynchronous processing, GPO caching, consolidated CSEs, filtered via security filters only, loopback set to replace, removed drive mappings, etc.
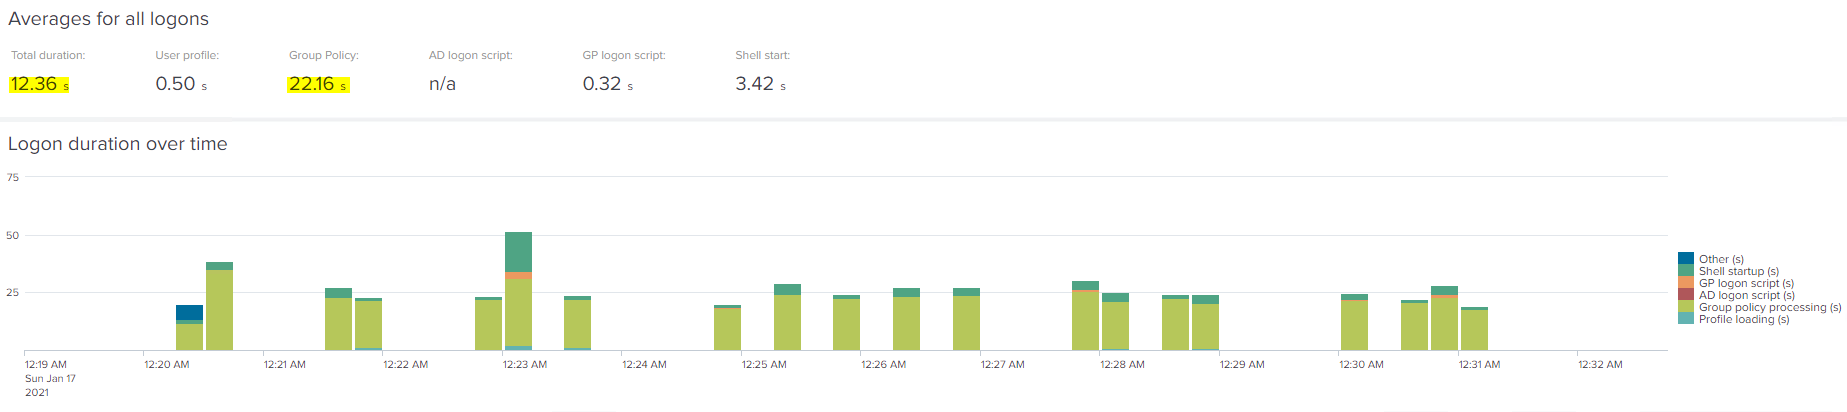
Now, as I said before, with asynchronous mode enabled the graphical representation is making it look like we haven’t improved much, but that’s because this includes the total GPO processing time which now continues after the logon has completed. Total GPO processing time is down from the baseline though – we’ve gone from a start of 24.86 seconds and now we are seeing 22.16 seconds. Now you’re probably wondering – when we tested in synchronous mode but with consolidated CSEs, we saw 9-10 seconds for GPO processing, but now with everything applied, it takes 20+ seconds? But like I said before, this is most likely due to the GP engine contending with user session processes in asynchronous mode, because normally it simply runs at logon and has a lot more resources to itself.
But that’s just a distraction, because – look at that logon time! Our baseline average time was 35.81 seconds – we’re now showing at 12.36 seconds. That’s a phenomenal improvement, and especially considering that we’ve simply concentrated purely on the Group Policy aspect of logon.
Here’s the raw logon data for each of the tests we ran. They’re a bit jumpy (some of the logons showed at sub-10 seconds, which is frankly phenomenal), but they average out pretty nicely.
Interestingly, when I first ran this test, I wasn’t seeing the improvements I’d expected, so I used uberAgent to troubleshoot it. The reason (thanks uberAgent!) turned out to be I hadn’t updated the computer GPOs on my targets (I could tell from the data because it mentioned they were running in Merge mode for loopback), so clearly the changes for Replace mode and also asynchronous policy processing hadn’t been applied. Isn’t it great having monitoring tools that can provide you with all of this information?
Summary
Group Policy Processing is quite likely one of the bottlenecks for your user logon times. In many large enterprise environments, the complexity and sheer weight of policies may make it intimidating to try and do something about it. But if you concentrate on some of the areas that we have highlighted in this article, it may well be something you can make some definite inroads into.
It also highlights (yet again!) why it is so important to get visibility into your logon times using a tool like uberAgent. The more data you have to work with, the more chance you stand of identifying and remediating problems in your environment.
Don’t be put off trying to improve your GPO processing – there are likely a lot of quick wins out there that can enhance your logon KPIs quite considerably
I’m sure some are wondering why I didn’t test the likes of Citrix WEM or Ivanti UWM and how they manage offloading. Time was rather pressing, but also WEM and UWM can offload so much more than just GPO settings, so I think it would be fairer to look at them in a separate article that addresses their full functionality and logon impact.
Stay tuned for some more Teams goodness coming soon, and the next part of this logons series which will tackle the problem of profiles. Also, as I said, there will be some extra articles in this series looking deeper into the subject of filters. And finally, here’s hoping we can soon get back to meeting up in person! I’ve had it with this lockdown guff to my back teeth 🙁
![]()
Hi James,
Some pics in this excellent article are unavailable, most of them the evidence… 🙂
Hi, I noticed this happening yesterday on other posts as well and reloaded them all in WordPress. If you refresh the page, do they then load? It looks like some oddity between WordPress and the browser….
I’ve changed the lightbox plugin, so hopefully should be all OK now…
Hey James,
Fantastic article. However, I’m not sure I fully understand what you mean by Consolidation of CSEs into single GPOs. Do you mind explaining further and share yours GPO/GPP settings ? Thanks.
Hi Jonathan
I mean putting each Client Side Extension (group of GP settings) into a SINGLE policy object. So for instance, all AppLocker settings in one GPO, all GPP Registry items in a single GPO, etc. However, given that Administrative Templates is a single CSE, that means you are looking at a VERY big set of settings for at least one of your policies, which makes troubleshooting difficult.
I have read carefully and noted this wonderful article.