
Everything you need to know about Windows logons in one blog series continues here!
I have threatened on several occasions now to do a follow-up to my previous article on Windows logon times which incorporates the findings from my “logon times masterclass” that I have presented at a few events. The time has come for me to turn these threats into reality, so this series of articles and accompanying videos will explore every trick we know on how to improve your Windows logon times. As many of you know, I work predominantly in Remote Desktop Session Host (RDSH) environments such as Citrix Virtual Apps and Desktops, VMware Horizon, Windows Virtual Desktop, Amazon Workspaces, Parallels RAS, and the like, so a lot of the optimizations discussed here will be aligned to those sorts of end-user computing areas…but even if you are managing a purely physical Windows estate, there should be plenty of material here for you to use. The aim of this is to provide a proper statistical breakdown of what differences optimizations can make to your key performance indicators such as logon time.
This series of articles is being sponsored by uberAgent, because the most important point to make about logon times is that if you can’t measure them effectively, then you will never be able to improve them! uberAgent is my current tool of choice for measuring not just logons (which it breaks down into handy sections that we are going to use widely during this series) but every other aspect of the user’s experience. All of the measurements in this series are going to be done via uberAgent, and as it comes with free, fully-featured community and consultants’ editions, there’s absolutely no reason that you can’t download it and start using it straight away to assess your own performance metrics. I’ve written plenty about uberAgent on this blog before, and I stand by it as the best monitoring tool out there for creating customized, granular, bespoke consoles that can be used right across the business. I’ve recently deployed it into my largest current client, so you can be sure I am putting my money where my mouth is – if it didn’t do the job, I wouldn’t have used it for my customers, simple as. Go and try uberAgent right now – you won’t regret it!
Part 2 – Storage and networks
Part 2 of this series is going to be a quick (and hopefully to all of you, very obvious and not particularly eye-opening) look at the impact of storage and networks onto the logon time KPI.
For the testing in this section, we have continued with a baseline of a vanilla build of Windows 10 2004 and a fully-patched Windows Server 2019 instance, both delivering a full desktop to users through Citrix Virtual Apps and Desktops 2006. The user profile is persistent, because we aren’t looking at profile management yet, but the profile is being removed between each logon. As stated above, we are using uberAgent to measure the logon times and taking an average from ten logons for each stage.
Storage
In my lab, we only have old-fashioned spinning disk and SSD to choose between, so we’re not getting a huge range of comparison between storage types. This isn’t the aim, though, what we are trying to show is merely an illustration of the importance of using the fastest available storage. Naturally, you should aim to get the quickest, most performant storage possible, taking into account cost, complexity, support, management and all the other factors that feed into this decision. Now how you deliver your images onto this storage can make a big difference to performance, but that’s a whole other consideration which will have to wait for a separate episode in this series. What we want to look at primarily here is simply the impact of storage speed on the logon times.
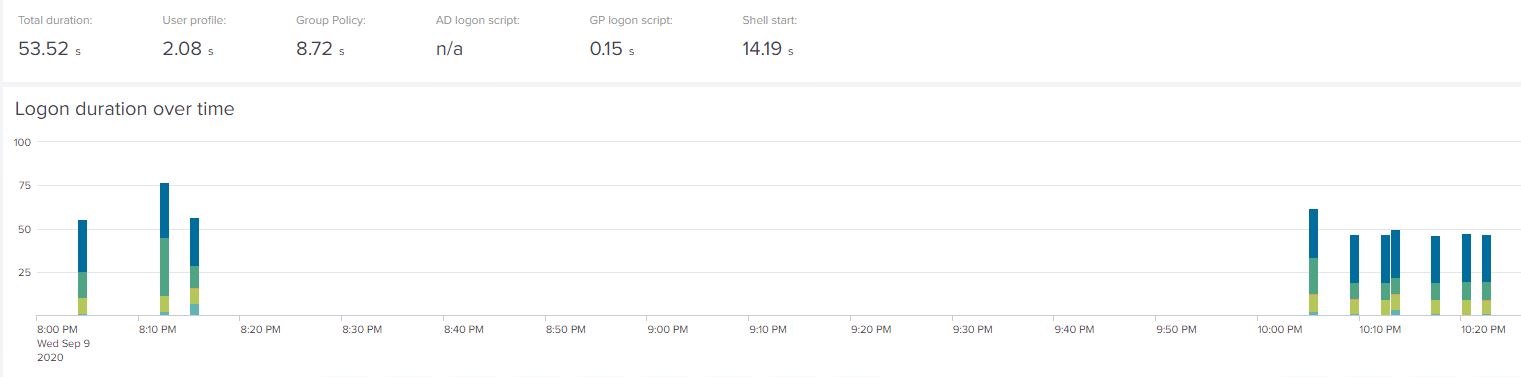
Firstly, let’s have a look at our base performance on a standard hard disk drive, firstly for Windows 10 (yes, I was interrupted in the middle of my tests!) :-
And now for Server 2019 RDSH:-

The Windows 10 average is 53.52 seconds and Server 2019 measures at 27.98 seconds – fairly similar to what we saw in part #1 of this series, although it seems slightly better (and this is unexpected, because we added Citrix Virtual Apps and Desktops to the mix). No problem, though, let’s just take this as our baseline. There was no observable TTOE increase that we spotted during testing, so we are happy with this as a starting point.
Now, let’s shift the worker servers – so the Windows 10 VDA and the Server 2019 VDA – to the SSD drive instead. Do we see any change?
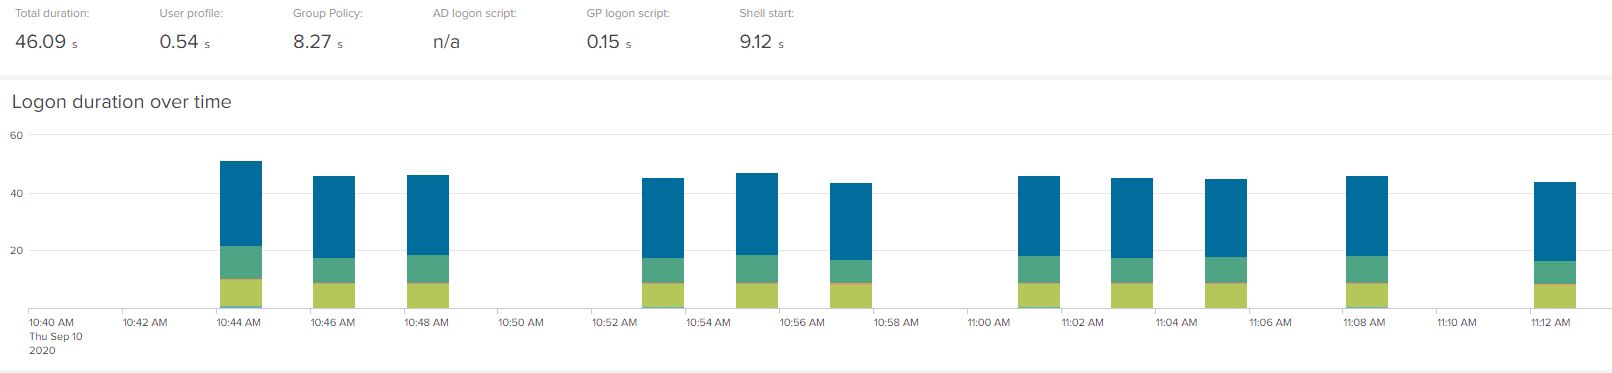
For Windows 10:-
For Server 2019 RDSH:-

Here we can see Windows 10 has reduced by approximately 7 seconds to 46.09, and Server 2019 has reduced by approximately 10 seconds to 17.25. If we look closer at the uberAgent breakdown, both of them saw a noticeable decrease in the profile load and shell start phases, but not much anywhere else. So we can conclude that moving the workers improves the parts of the logon processes that are actually happening on the endpoint itself.
This raises an important point that you need to be aware of – logon isn’t just about what happens on the device itself, the rest of the infrastructure matters too. So let’s go a step further and move all of our Citrix infrastructure servers and our domain controllers onto the faster storage tier as well.
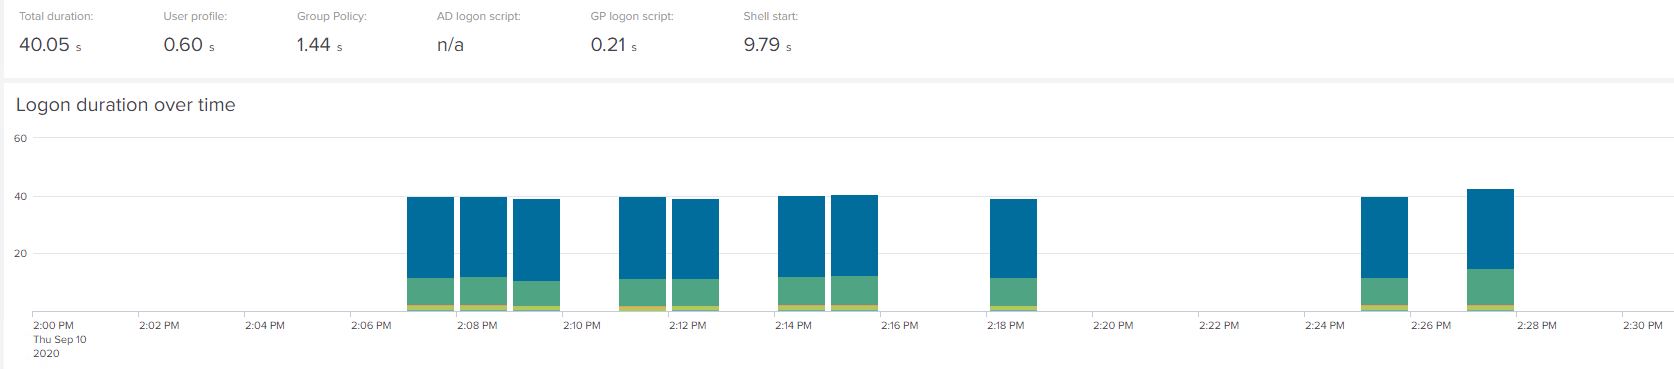
What do we see after we’ve done this? Well, for Windows 10:-
And here are the numbers for Server 2019 RDSH:-
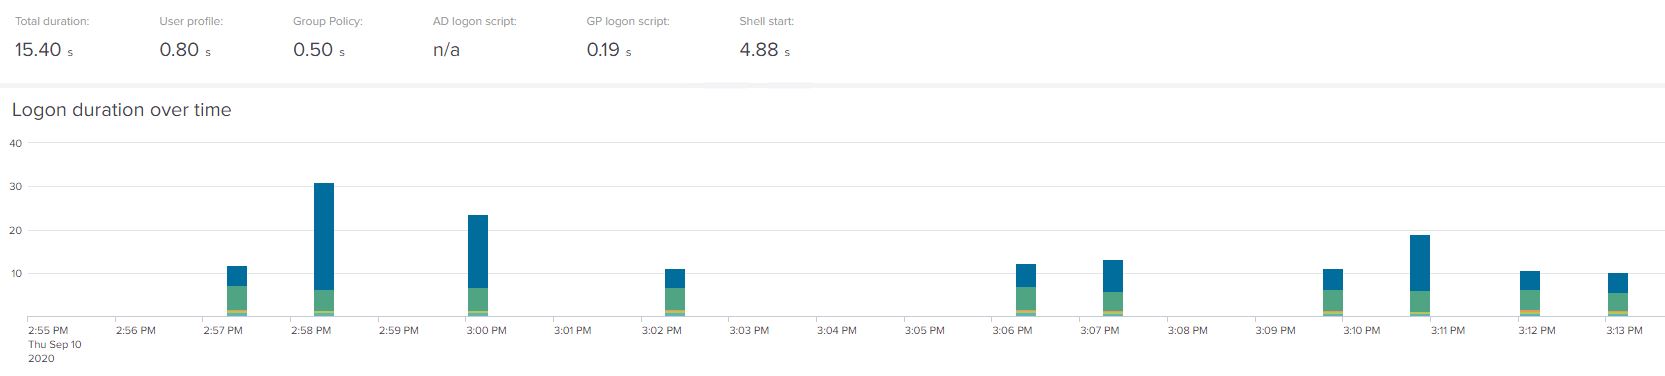
Now we’ve brought Windows 10 down another six seconds (now at 40.05) and Server 2019 is sitting very pretty at 15.40 (taking off another two seconds or so).
Increasing our storage speed across all components gives us a 25% logon performance uplift on Windows 10, and a 45% logon performance uplift on Server 2019
So the evidence is pretty solid (although I’m sure you all knew it already) – getting faster storage for all of the moving parts can make a noticeable impact onto your logon times.
Networks
Now, networks are another core component that should ideally run as fast as possible. But it’s not solely about having good network speed – you also need to make sure you aren’t generating excessive traffic, that you aren’t experiencing packet loss or latency, and that your configuration is optimal.
Unfortunately on my lab network I can’t seem to be able to voluntarily saturate the internal links, even when my children are in full gaming mode – modern technologies seem to be much more aware of the importance of avoiding network overload. However, I can use my old friend Network Emulator for Windows Toolkit (or NEWT) to simulate packet loss, latency and bandwidth restrictions on the network interfaces of the components in a typical EUC setup.
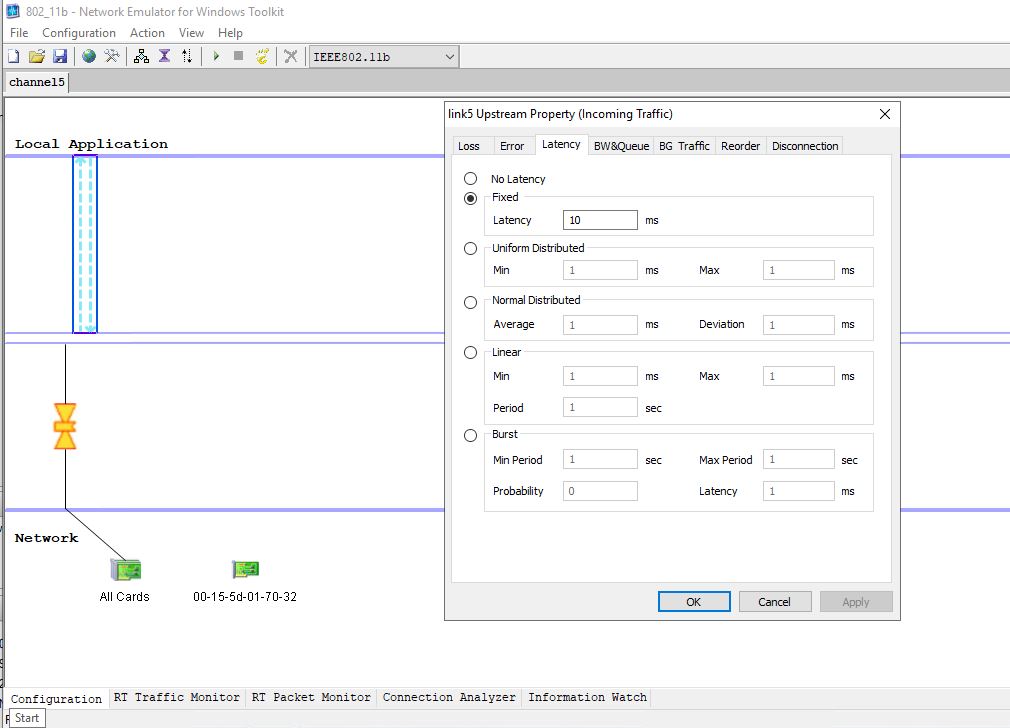
We didn’t go crazy here – but firstly we increased the latency, packet loss and error frequency on the client we were using to launch the Citrix session.
After that, we also increased the network problems on the supporting infrastructure (the Citrix DDC, Storefront, and Active Directory servers).
Finally, for a third phase, we went the whole hog and increased the network problems on the actual RDSH worker servers themselves (not testing Windows 10 separately here, as we would expect to see similar results no matter what the operating system).
The results are shown below – phase one (client) highlighted in yellow, phase two (infra) in amber, and phase three (workers) in red.
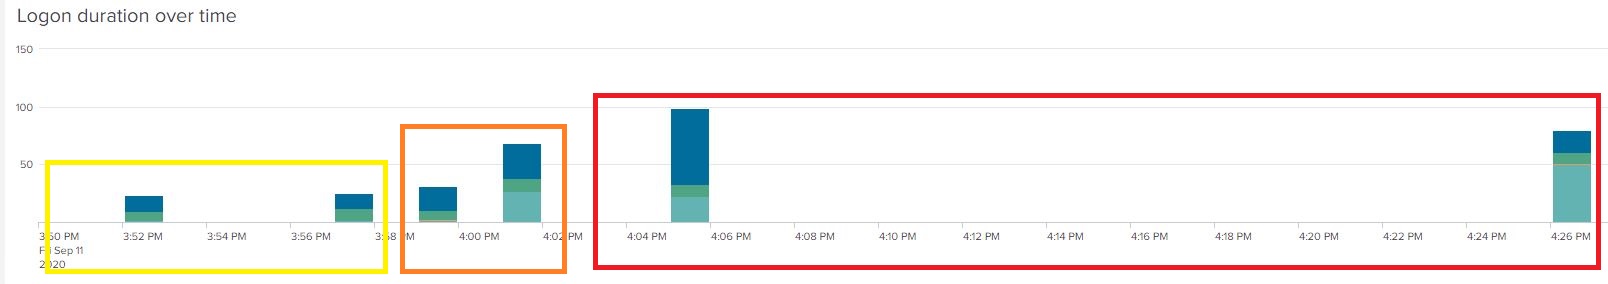
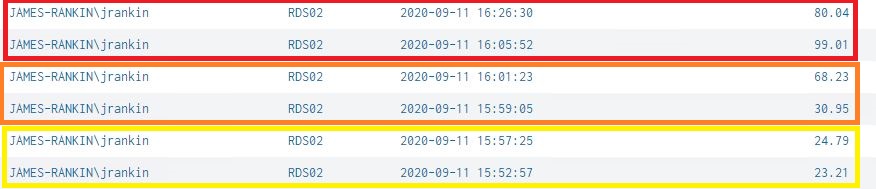
What can we deduce from this? Well, firstly, a level of network problems on the connecting client that stays short of actual connection interruption doesn’t cause that much of an uptick in logon time. This speaks to the resilience of the Citrix Workspace App in troublesome network conditions. It only increased by about ten seconds or so – a significant increase in the wider frame of things, but not a huge concern given that we were deliberately introducing packet loss and errors.
The second phase, when we impacted the Citrix and AD infrastructure, is significant because we saw a variation in the uptick. Now, NEWT randomizes the problems it deliberately causes, so it is possible that we simply saw a worse impact on the second timing here that affected a key component of the logon, but it does show that having network problems at that level can cause a significant uptick – longer than a minute, which is vastly more than our baseline.
But finally, as far as logon times are concerned, the third phase (when we impact network performance on the worker itself) is the worst. Obviously, I am sure you all could have predicted this, but the data bears out that if you are in an EUC environment, the actual worker devices themselves are where you need to make sure that everything network-related is functioning without issue. Again, the data shows variations, but we’ve managed to stack another huge increase up at this stage.
Summary
I’m sure everyone reading this could have foreseen this result, but just to summarize:-
When it comes to storage and networks, speed, optimal configuration and avoidance of errors is absolutely critical to logon times.
There are many, many other factors you can go into when broaching this subject – and it is worth calling out that if you’re on-premises, looking at hyperconverged solutions such as Nutanix offers a wealth of features that can help everything run better, not just your logons – but there are many community resources out there that do a far better job of covering these areas than I could. I want to keep this series specifically focused on logon times, and to avoid going off on a tangent that could get very long and detailed, let’s just concentrate on the obvious. Make your networks and storage as fast as you can afford, and spend the time and effort required to make them – and keep them – properly optimized and error-free. Again, I keep coming back to this point – monitoring of infrastructure components such as networks and storage is vital, and you should invest in technologies (such as uberAgent) that can help you in a holistic monitoring solution. To be fair, getting your storage and networks up to scratch isn’t simply something you should look at from a perspective of logon times – they underpin your whole environment and should never be less than the best you can possibly get.
Now then – what’s next in this series? Well, you may have noticed in the first two parts we have concentrated simply on pure vanilla builds. That doesn’t reflect anyone’s environment, so for the next instalment we are going to put together a fully-functional enterprise image with layers of policies, applications, drive mappings, printers, security tools, configuration services and all the other cruft that you find within a typical estate, and see precisely how badly this all affects our logon times. Then we will start a series of deep-dives into the impact of all these moving parts – provisioning, policy, antivirus, profile management, etc., etc., etc. I have a couple of webinars coming up that might mean part #3 is a week or so away at the earliest (feel free to sign up for my presentation on COVID-19 impact which is coming soon!), but hopefully there will soon be more material here for your perusal.
![]()