
Part #3 of an in-depth exploration of the uberAgent product – living with it longer-term
If you haven’t read part #1 and part #2 of this article yet, then you’re coming in half-cocked. Go and read those first!
We left our overworked systems administrator AdminX having found that uberAgent seems to tick their requirement boxes and feeling pleasantly surprised by the data that they are receiving. Which is good – forming a meaningful relationship with a product is always a good start.
But how will the relationship develop? It’s all very well enjoying the first experience, but as time goes on, and you try and develop a software suite to meet your ongoing needs, you potentially start to expose its limitations. It’s not a question of *if* you find limitations – software without limitations is a myth – but how easily you can adapt the suite to meet your requirements.
I’ve had experiences in the past with software that started in a very exciting fashion, but slowly fizzled out after the hard shortcomings of the product were exposed over a longer period of time. Which is why this stage of your exposure to the suite – how the “relationship” develops, as it were – is quite vital.
Getting longer-term
I guess it’s a bit odd to talk about having a “relationship” with a piece of software, but I think that if an administrator is being asked to use something every working day, then relationship is the best word to describe it. And like human relationships, they can have ups and downs.
This is not to say that all you will discover over the passage of time is limitations and frustrations – you can uncover new features and shortcuts that actually enhance your experience. So let’s look at how we’ve managed to develop our use of uberAgent over a period of time.
Tracking KPIs
We mentioned that AdminX was particularly interested in logons (and coincidentally an area I am particularly interested in too). We all have those users that will complain about key performance indicators and some of them will do it very loudly. What you need to do here is be able to trend the performance of these KPIs over time so that you are being purely objective about the problem the user is describing. Let’s not forget – one person’s fast is another person’s slow. What we want to do is to be able to see the *real* metrics so we can decide if there is an actionable problem, and we want to be able to see them quickly and easily. If we don’t deal with a user’s gripes in a timely fashion, they will become frustrated, escalate the issue, generate a bad perception of your solution throughout the business as they talk to other users – any number of unwanted potential outcomes. It is essential that this information is easily available, accurate and detailed.
I have to say it’s a breeze to get at this information and I find it really helpful. Finding your way into uberAgent | Sessions | Logon duration is nice and intuitive and you can quickly set up logical filters to get at the data you need.
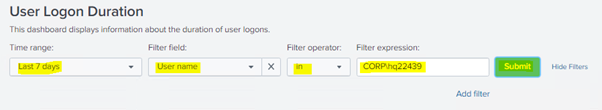
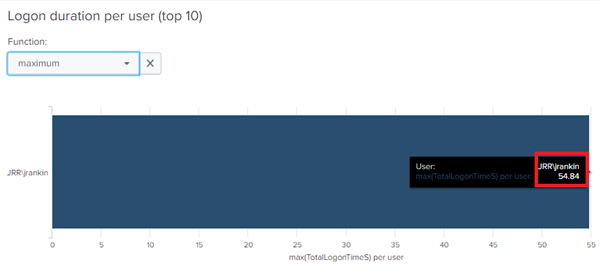
Let’s have a look at a user that we have (artificially!) created a logon problem for and see if it immediately shows up as an issue.
First of all, how quickly does uberAgent get data from my user metric (which in this case is logon time) back to the console so AdminX can see it? The answer is, very quickly – I had actually just completed logging on, ran a query, and I could view the logon data instantly. Whilst I appreciate this is a lab environment, it gives me a good feeling to see that the metric is instantly processed and presented.
After I’ve logged on five times I can see that the user is presenting a healthy average of about 11-12 seconds.
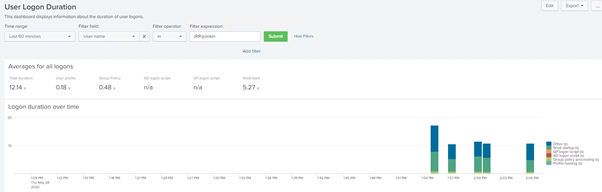
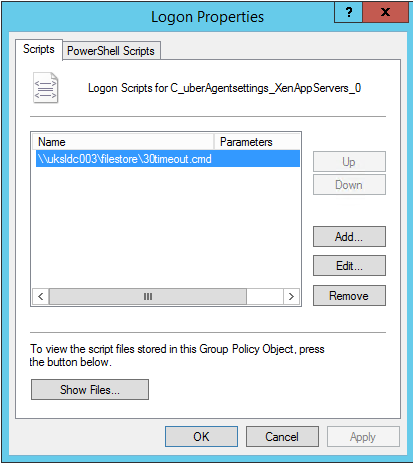
Now let’s introduce a problem, in this case we will configure a logon script that waits for 30 seconds to process.
If I repeat the logon, instantly I can see that there is a deviation from the trend.
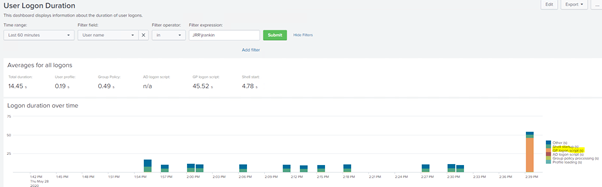
Now not only is it telling me there has been a substantial uptick, I can also see (by the colour coding) that it is my GPO logon script which is causing it!
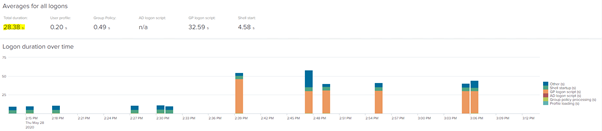
This extrapolates nicely out to identifying trends. Even across a user base of thousands of users, I can sort by longest logon and immediately see that there was one particular issue.
But also, if there is a problem not specific to the user which would affect the environment in general, I can also see that easily, because there is an increase in the average logon time instead. So if we repeat the problematic logon a number of times, we can see the average time increases away from the 11-12 second baseline we had established earlier. It’s now at a whopping 28 seconds.
So in summary, AdminX is finding the information useful and easy to trend going forwards. The filtering is intuitive and easy enough to adapt.
Deeper views
A lot of administrators (possibly including AdminX) often look to replicate functionality they’ve seen in other tools so arrive with certain expectations of what they might get to see. One of the more common ones is an overview of devices that are currently under the auspices of the monitoring implementation, so let’s use this as an example of our admin wanting to “dig deeper”.
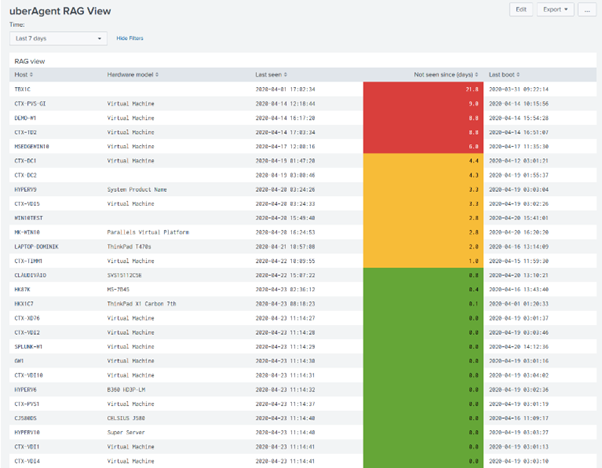
Now in uberAgent the closest you can get to an overview of the devices under management is by using the Machines | Machine Uptime view and looking at the “Last Seen” entry. It’s important to remember that uberAgent doesn’t operate in the same way as many other products out on the market, in that maybe you give it an Active Directory Organizational Unit to operate on that may contain many different devices. The uberAgent endpoint simply sends the data into the Splunk server – the server isn’t “expecting” all members of an OU to check in.
However, the beauty of uberAgent is that it has the inherent flexibility provided by the Splunk architecture underneath. Often, with other monitoring tools, it can sometimes be challenging to mould them to specific requirements. But with uberAgent we simply create a custom dashboard.
You can access this by opening up another Splunk app which is already pre-installed, the Search and Reporting app. Under Dashboards, there is the option to create a new dashboard.
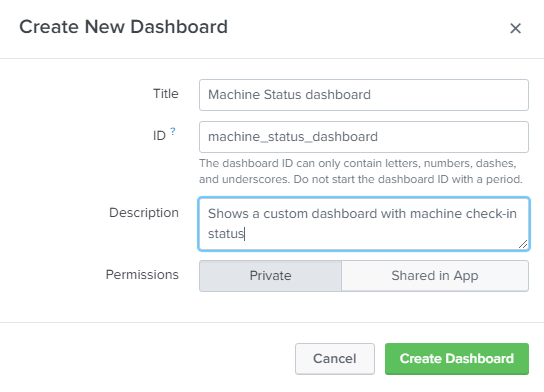
Now, once you’ve done this you can add panels through the user interface to customize your dashboard, or alternatively you can speak to the helpful people from uberAgent who will simply give you some XML to paste in direct ? I think this is a very important point to make too, as good support is an essential part of getting AdminX from unfamiliarity to competence.
I was very impressed that this worked out of the box and uses the “Last Seen” metric to set a RAG view for the machines that are reporting in to the console. So if a machine falls out of management scope, for whatever reason, we can easily see that there is an issue and initiate some corrective action.
When creating Custom Dashboards, however, you have to access them by going to Splunk | Dashboards. While it seems like it would be best to add them to the uberAgent menus (and this could be done by modifying the XML files), this might potentially cause issues when it comes down to uberAgent upgrades. All of this flexibility is one of the reasons why the uberAgent/Splunk combination is so compelling, but we can’t reasonably expect the uberAgent development staff to take into account every possible custom dashboard when planning their upgrade processes. So custom dashboards are best accessed from the Dashboards menu (which you could easily create a browser shortcut to), or maybe (if you’re feeling clever) by adding your own Splunk app.
Another point to make is that you can simply alter the default views of the dashboards by adjusting the URLs slightly. AdminX finds it a bit annoying that the basic view for his Logon Duration filters to Host rather than User Name, so you can simply change this base URL, for example
to this one
and you have a customized view. This can be added as a browser shortcut as well to let you quickly configure customizations as to how you would like your data and filtering presented.
You can also edit the dashboards directly and add or remove elements (although I’d be very careful about this, and would only do it if I had copied an existing dashboard, not work on one of the pre-built ones)

Furthermore, you can create new dashboards with elements from different data areas and combine them to create fully-customized home page dashboards for different users. This is where it is really starting to shine – AdminX can have executive overviews for his management users, status pages for different support units, etc.
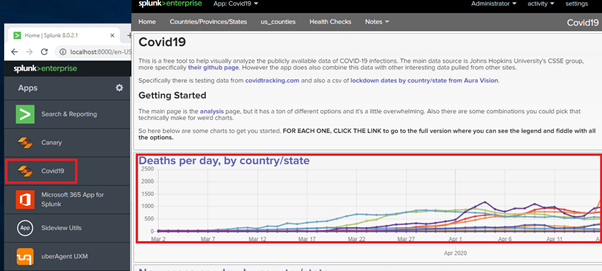
I have to admit at this point I started getting really excited about the power and customization at your fingertips. It does feel a bit intimidating at first, but as long as the support is good – which it has been – then it feels like you can really start to build something that works specifically for your business case. And this is something that, I have to admit, other monitoring tools I’ve worked with fall a bit short on. It’s all very well to be impressed by dashboards and metrics, but the key is putting them together in a meaningful way that offers really specific value to your administrators. Being able to blend in data from many different Splunk apps and sources only makes it better – for instance, I added a COVID-19 infection tracker to my home dashboard! Now that might seem to be me just trying to showboat a bit – but imagine if you could add business-specific dashboards there too; share prices, call volumes, etc. The flexibility allows us to create customized dashboards and views way beyond what you normally get “out-of-the-box”.
Operational issues
I could wax lyrical for a long time about the different data views we can present but I think we’ve made that point sufficiently. But how can uberAgent help us with operational problems? That’s something AdminX is obviously very keen on.
I’m going to take a real-world issue as an example here. AdminX has identified a problem on some of his servers with port exhaustion. This happens when dynamic ports are allocated to a process but not released properly, resulting in the upper limit of 16,000+ ports being taken up. When this happens, it’s quite a drastic event. All network communication starts to fail – the machine cannot access file shares, make LDAP queries, and many other errors occur that often result in a complete restart being required.
Port exhaustion is generally tied to faulty software – a particular process is not relinquishing the handles that it is opening. It is easy enough to identify the process which is causing the problem – a netstat command is sufficient to show the culprit. But in this case, the vendor needs time to perform full debugging and look for a solution because it is unique to the customer. How can a monitoring tool help us in the meantime while we wait for the vendor to complete the required level of investigation? What we really want to do is identify when the port exhaustion is potentially becoming an issue – it is, as I said, a fairly drastic event and often occurs with little or no warning.
This leads us nicely into uberAgent’s scripting powers. The uberAgent script execution engine can take scripts written in any language, and execute them at any interval, per device or per user. It captures anything that produces standard output and sends every line to the Splunk backend as a single event. It is restricted to running in the context of the LocalSystem account (so you would need to store your scripts locally rather than on the network, but pretty much this is what we have to do with Scheduled Tasks anyway). I find the ability to use any scripting language pretty awesome (IT CAN EVEN USE BATCH COMMANDS!) – so even for a dinosaur like me, I can create or repurpose scripts that I already have written. I have hundreds of Windows command scripts, many dating back to the NT4 days, and being able to reuse these rather than rewrite them is awesome.
So what AdminX could do is either write a script to directly query the port usage per process, and then call this script via the engine within uberAgent (for instance, if written in PowerShell, it would be very similar to how you call a Scheduled Task). You additionally supply values for the interval and the execution context. The output of the script would then be sent to Splunk, and then you can configure a search to parse the output of that script and present it in a dashboard view. So AdminX could, admittedly with a bit of learning, soon have something configured that would report on how many ports a process had open and issue an alert when at a specific level.
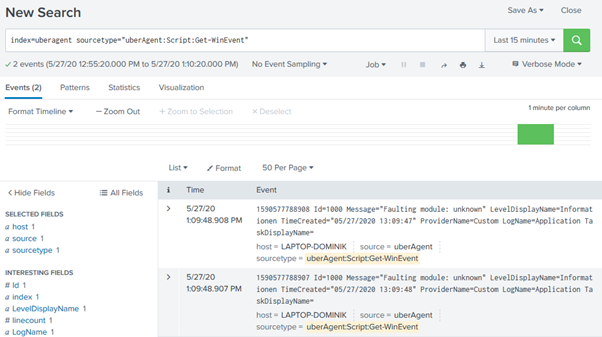
Of course, if you want it a bit simpler, then you can create a more straightforward script to generate data based around Windows event IDs. Port exhaustion is normally preceded by Windows events that give you an idea it is beginning to happen, and Application log ids 4231 and 4227 are normally logged as soon as the range becomes full. This article provides instructions on how to set up monitoring and logging for specific event ids.
In this case you simply create a PowerShell script on your target endpoints and call it from a timer within your uberAgent configuration. Once the output from here is uploaded to Splunk at the specified interval, then you will be able to query this data through the search or through a customized dashboard view.
So now AdminX can gain some alerts and insights into when the port exhaustion issue may flare up again, allowing them to take some proactive steps to guard against it (such as restarting the errant process, which in this particular real-world case was a Windows service).
Built-in extensions
However a lot of this customization can, admittedly seem like a little bit of a steep curve for some administrators. But, never fear, because at uberAgent they are actively adding apps and functionality that can help shoulder some of the burden.
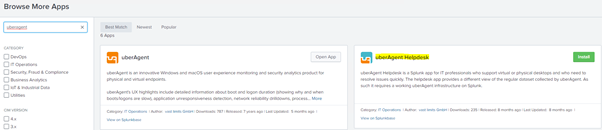
The uberAgent HelpDesk app is a case in point. This is another cool bit that is growing on me about uberAgent – it leverages the SplunkBase delivery mechanism so you can just go and browse for apps that extend your functionality. You simply go and search the apps – it’s kinda like a “Store” really, in that respect – and then just log in and perform the installation.
I like the helpdesk app because it is simply a built-in dashboard you can assign to support users who need to troubleshoot user issues. It allows them to search for a user and then displays information about them directly. So you can see the modus operandi – a user calls in to report a problem, and the agent fielding the call can instantly search for and access all of the relevant information on that user and their current sessions. Simply enough – it’s a pre-built dashboard targeted to a specific use case. I’d love to see more of these coming along based around different situations and departments, it really gets things moving quickly. Maybe an “uberAgent executive overview” could be next, along with an “uberAgent Report Centre” – I’m just brainstorming here, but you get the idea; these pre-built apps could be the building blocks that mean you have to put a lot less of your own “glue” into the solution to get it looking exactly the way you want it.

There’s a huge amount of detail, client information, session information, key performance indicators, application usage – lots of data to help pinpoint the issue the user may be having.
Summary
I could find more details to point out here, but I don’t want to flood this article with lots of specific pointers. The key question I was trying to address was – how exactly is the longer-term experience of uberAgent turning out?
uberAgent is incredibly flexible, and the longer-term experience is mainly characterized by finding out more and more cool things you could potentially do. Rather than feeling like I’m constrained by the software, the integration with Splunk and Splunkbase means I am always thinking of new views and monitors I can create. I like this a lot – it really feels like you’ve got a piece of software you can mould to your exact requirements rather than being constrained into a particular way of presenting your metrics and data.
But obviously this has a flip side. The more you customize, the more work you have to put in, and I feel like learning all of these new things like how to search Splunk data could be a little bit off-putting for some people.
This is where it becomes down to uberAgent themselves to shine, to help bridge that gap between what is familiar and what is possible. Their documentation is good and their support staff are really competent and helpful, and that makes a big difference when you are familiarizing yourself with the product. If they continue to provide more “ready-made” apps as building blocks (like the Helpdesk app), then the pathway to embracing uberAgent and Splunk becomes easier and easier. I hope they continue to do this, because I like the amount of data I get from it, I like the ease of filtering and customization, and I want to be able to build really focused, granular dashboards for diverse sets of users.
Stay tuned for the final part of this series, where we will ask the big question – what’s the final verdict, and should you start an uberAgent trial immediately?